Forecast Center
November/December 2001
by TIM VASQUEZ / www.weathergraphics.com
|
This article is a courtesy copy placed on the author's website for educational purposes as permitted by written agreement with Taylor & Francis. It may not be distributed or reproduced without express written permission of Taylor & Francis. More recent installments of this article may be found at the link which follows. Publisher's Notice: This is a preprint of an article submitted for consideration in Weatherwise © 2001 Copyright Taylor & Francis. Weatherwise magazine is available online at: http://www.informaworld.com/openurl?genre=article&issn=0043-1672&volume=54&issue=6&spage=66. |
PART ONE: The Puzzle
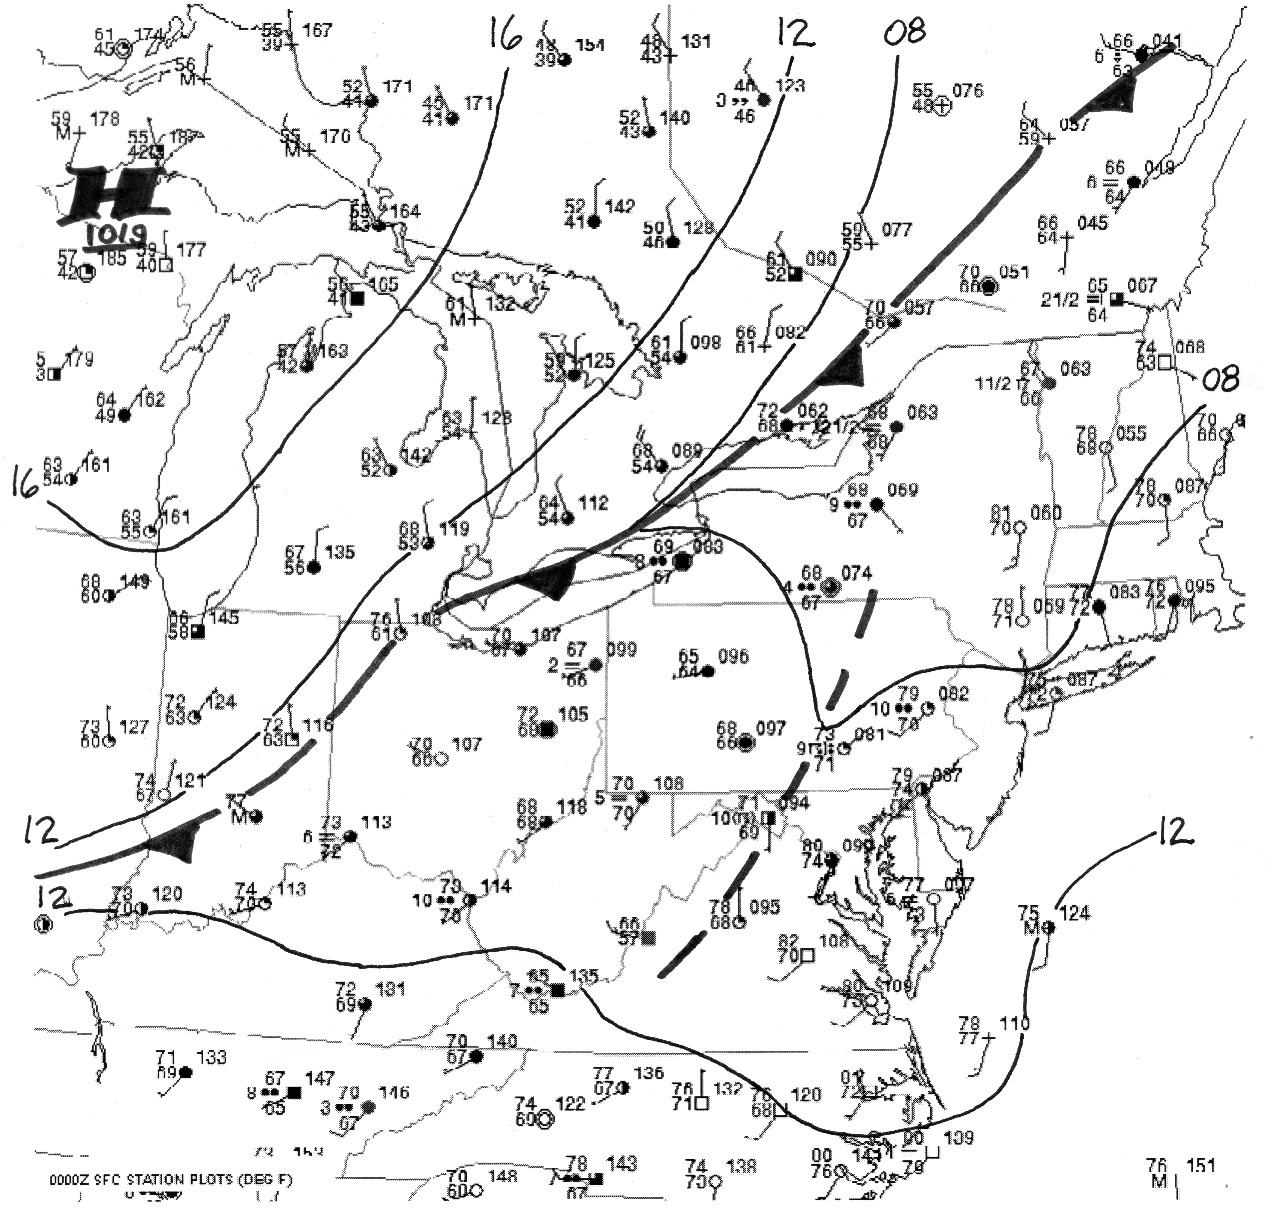
The following puzzle is for 8 pm EDT on a day in late summer day in 2001. New England had been suffering through weeks of agonizing heat and humidity. However this weather chart showed a nice surprise on the way!
Draw isobars every four millibars (992, 996, 1000, 1004, etc.) using the plot model example at the lower left as a guide. As the plot model indicates, the actual millibar value for plotted pressure (xxx) is 10xx.x mb when the number shown is below 500, and 9xx.x when it is more than 500. For instance, 027 represents 1002.7 mb and 892 represents 989.2 mb. Therefore, when one station reports 074 and a nearby one shows 086, the 1008 mb isobar will be found halfway between the stations.
Hint for beginners: You can expect to find one cold front and one high pressure center. Bear in mind that the cool temperatures over the Appalachians are caused by thick cloud layers and rain, not by cool Canadian air. A quick check of the muggy dewpoints confirms this fact.

Click to enlarge

* * * * *
Scroll down for the solution
* * * * *
PART TWO: The Solution
In New England when the calendar turns to September, the haze and oppressive humidity has worn out its welcome and the air is charged with excitement because of the crisp weeks of autumn just around the corner. These delightful days are produced by Canadian air that sweeps southeastward through the Great Lakes region with increasing frequency, scouring out stagnant tropical air. The evening of August 31, 2001 provides a glimpse at such a pattern.
A quick glance at the weather map shows that temperatures along the Atlantic Coast were in the 80s with muggy 70s dewpoints. Meanwhile, Ontario enjoyed brisk north winds and temperatures in the 40s and 50s. This was a clear indicator that two air masses were in place. The only question was where the front separating these air masses was located. The leading edge of the cool temperatures served to define the front's location, and northerly wind direction and drier dewpoints helped define it further.
One factor complicating the analysis was the low-70s temperatures stretching along most of the Appalachians. This was associated with a plume of subtropical moisture bringing thick clouds (note the dark station circles) and rain that dampened solar heating and provided evaporational cooling. However, the presence of upper-60s dewpoints and weak southerly flow show that this air mass was still tropical and was not part of the cold front's southerly advance.
Click to enlarge
©2001 Taylor & Francis
All rights reserved