Forecast Center
March/April 2002
by TIM VASQUEZ / www.weathergraphics.com
|
This article is a courtesy copy placed on the author's website for educational purposes as permitted by written agreement with Taylor & Francis. It may not be distributed or reproduced without express written permission of Taylor & Francis. More recent installments of this article may be found at the link which follows. Publisher's Notice: This is a preprint of an article submitted for consideration in Weatherwise © 2002 Copyright Taylor & Francis. Weatherwise magazine is available online at: http://www.informaworld.com/openurl?genre=article&issn=0043-1672&volume=55&issue=2&spage=74. |
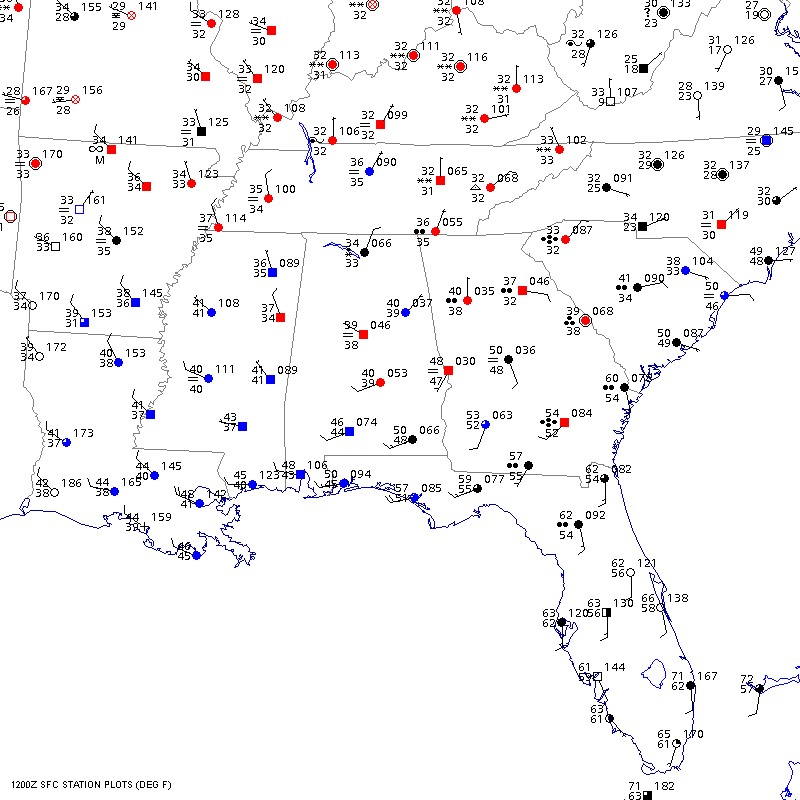
PART ONE: The Puzzle
The first week of 2002 was unforgettable for many Americans who travelled by air. A massive Arctic front swept through the southern United States, immersing the region with snowfall and forcing the shutdown of Atlanta Hartsfield Airport. However, as so often happens early in the season, a backlash occurred when this cold front interacted with warm Gulf of Mexico waters, leading to the formation of low pressure. This low pressure system migrated northeast along the cold front, leading to the stormy mix of rain and snow shown on the map.
Draw isobars every four millibars (992, 996, 1000, 1004, etc.) using the plot model example at the lower right as a guide. As the plot model indicates, the actual millibar value for plotted pressure (xxx) is 10xx.x mb when the number shown is below 500, and 9xx.x when it is more than 500. For instance, 027 represents 1002.7 mb and 892 represents 989.2 mb. Therefore, when one station reports 074 and a nearby one shows 086, the 1008 mb isobar will be found halfway between the stations.
Hint for beginners: You can expect to find a cold front, a warm front, and an occluded front.
Click to enlarge

* * * * *
Scroll down for the solution
* * * * *
PART TWO: The Solution
The solution reveals a classic winter weather system which affected the southeast United States on January 6, 2002. The first thing a forecaster would notice is the strong temperature contrast between the balmy 60s in Florida and the the brisk 30s stretching from Tennessee to the Carolinas. The forecaster realizes that a front will be found somewhere between the two.
Closer inspection will reveal a low pressure area. This low is not at its usual location along the boundary between warm and cold air but has detached itself and receded back into the cold air near Alabama. This is a clear indication that the frontal system has occluded, a process that occurs over a period of days when cold air wraps completely around a low pressure area and cuts it off from the sharper temperature contrasts (the "baroclinic zone") that favor continued development. The low usually decays while a new, energetic baroclinic low forms at the new boundary between cold and warm air. The cycle tends to repeat itself.
A map such as that shown here is quite often the precursor for intense coastal storms (sometimes referred to as nor'easters). Developing along the Georgia and Carolina coast, these lows migrate northward along the coast, fed by the baroclinic zone that lies between cold continental air and toasty Atlantic air warmed by the Gulf Stream current. By the time they reach New England, these lows are quite deep, bringing powerful winds and intense precipitation.

Click to enlarge
©2002 Taylor & Francis
All rights reserved