Forecast Center
September/October 2002
by TIM VASQUEZ / www.weathergraphics.com
|
This article is a courtesy copy placed on the author's website for educational purposes as permitted by written agreement with Taylor & Francis. It may not be distributed or reproduced without express written permission of Taylor & Francis. More recent installments of this article may be found at the link which follows. Publisher's Notice: This is a preprint of an article submitted for consideration in Weatherwise © 2002 Copyright Taylor & Francis. Weatherwise magazine is available online at: http://www.informaworld.com/openurl?genre=article&issn=0043-1672&volume=55&issue=5&spage=74. |
PART ONE: The Puzzle
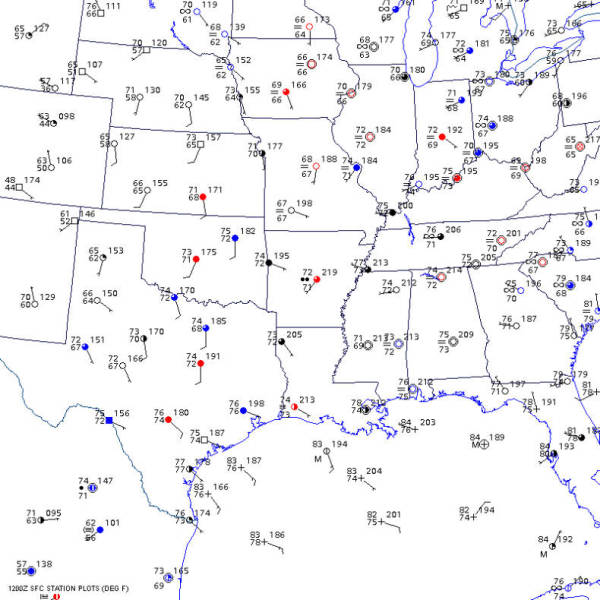
After the turbulent months of spring settle down, summer arrives. Katydids and cicadas drone in the oak forests, while wind vanes stare dreamily at the southern horizon. Dewpoints creep up into the 70s, and the occasional rain shower blots out the fading evening sun. It's true that summertime brings one of the most monotonous weather patterns to the United States, however it only takes minor changes to stir up unexpected weather. In this puzzle, we'll take a look at a real weather event for July 2002 as revealed by a surface weather map.
Draw isobars every four millibars (992, 996, 1000, 1004, etc.) using the plot model example at the lower right as a guide. As the plot model indicates, the actual millibar value for plotted pressure (xxx) is 10xx.x mb when the number shown is below 500, and 9xx.x when it is more than 500. For instance, 027 represents 1002.7 mb and 892 represents 989.2 mb. Therefore, when one station reports 074 and a nearby one shows 086, the 1008 mb isobar will be found halfway between the stations.

Click to enlarge

* * * * *
Scroll down for the solution
* * * * *
PART TWO: The Solution
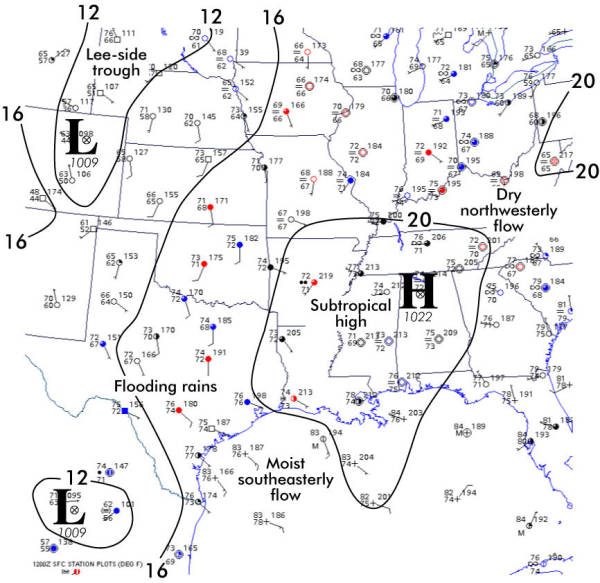
This issue's puzzle shows a large subtropical high across Mississippi and Alabama on the morning of July 17, 2002. Two low-pressure areas can be found, one in Mexico and another in Colorado. Polar air masses remain far north in Canada, so no fronts are present on this map.
During the warm season, the air masses over land are warmer and less dense compared to oceanic regions. This favors high pressure over the Atlantic and Pacific Oceans and low pressure over the land masses. The Atlantic Ocean high pressure area is often referred to as the "Bermuda High". Its clockwise circulation creates a broad zone of southerly flow across the eastern United States. When there are disruptions in this pattern, unusual weather is the result. In this example, the Bermuda High is weak and has become fragmented. A large piece of it is anchored over Alabama and Missisippi.
In Texas, proximity to this strong subtropical high strengthened the southeasterly wind flow. This is revealed by the "packed" isobars along the Texas coast. Very rich, moist tropical air flowed from the Gulf of Mexico into the state, with mid-70s dewpoints being reported at Houston, Corpus Christi, and Victoria. Not surprisingly, San Antonio was about to receive yet another afternoon of flooding rains with this infusion of Gulf moisture. Some locations had already received over 30 inches of rain.
Meanwhile, Georgia, the Carolinas, and north Florida, located east of the subtropical high, were under northwesterly flow. This brought drier air from the continental Kentucky and Tennessee area southeastward. The drier air and absence of clouds allowed daytime temperatures to soar. Macon, Georgia reached 100 degrees, coming within 2 degrees of the record for the date, while Tallahassee, Florida reached 99. Tampa broke its record for the date at 96 degrees.

Click to enlarge
©2002 Taylor & Francis
All rights reserved