Forecast Center
March/April 2003
by TIM VASQUEZ / www.weathergraphics.com
|
This article is a courtesy copy placed on the author's website for educational purposes as permitted by written agreement with Taylor & Francis. It may not be distributed or reproduced without express written permission of Taylor & Francis. More recent installments of this article may be found at the link which follows. Publisher's Notice: This is a preprint of an article submitted for consideration in Weatherwise © 2003 Copyright Taylor & Francis. Weatherwise magazine is available online at: http://www.informaworld.com/openurl?genre=article&issn=0043-1672&volume=56&issue=2&spage=74. |
PART ONE: The Puzzle
Winter weather in the northern United States is often dominated by cold high pressure. Polar air masses ooze southward with clockwork regularity, marching into the United States once or twice a week like giant icebergs invading a wintry ocean. Once they take root over an area, the days are dry, brisk, and sunny and the nights clear and chilly. When these polar outbreaks are on the move, they are often orchestrated by fascinating, dynamic weather systems. In this issue we'll take a look at one such example in the Great Lakes region.
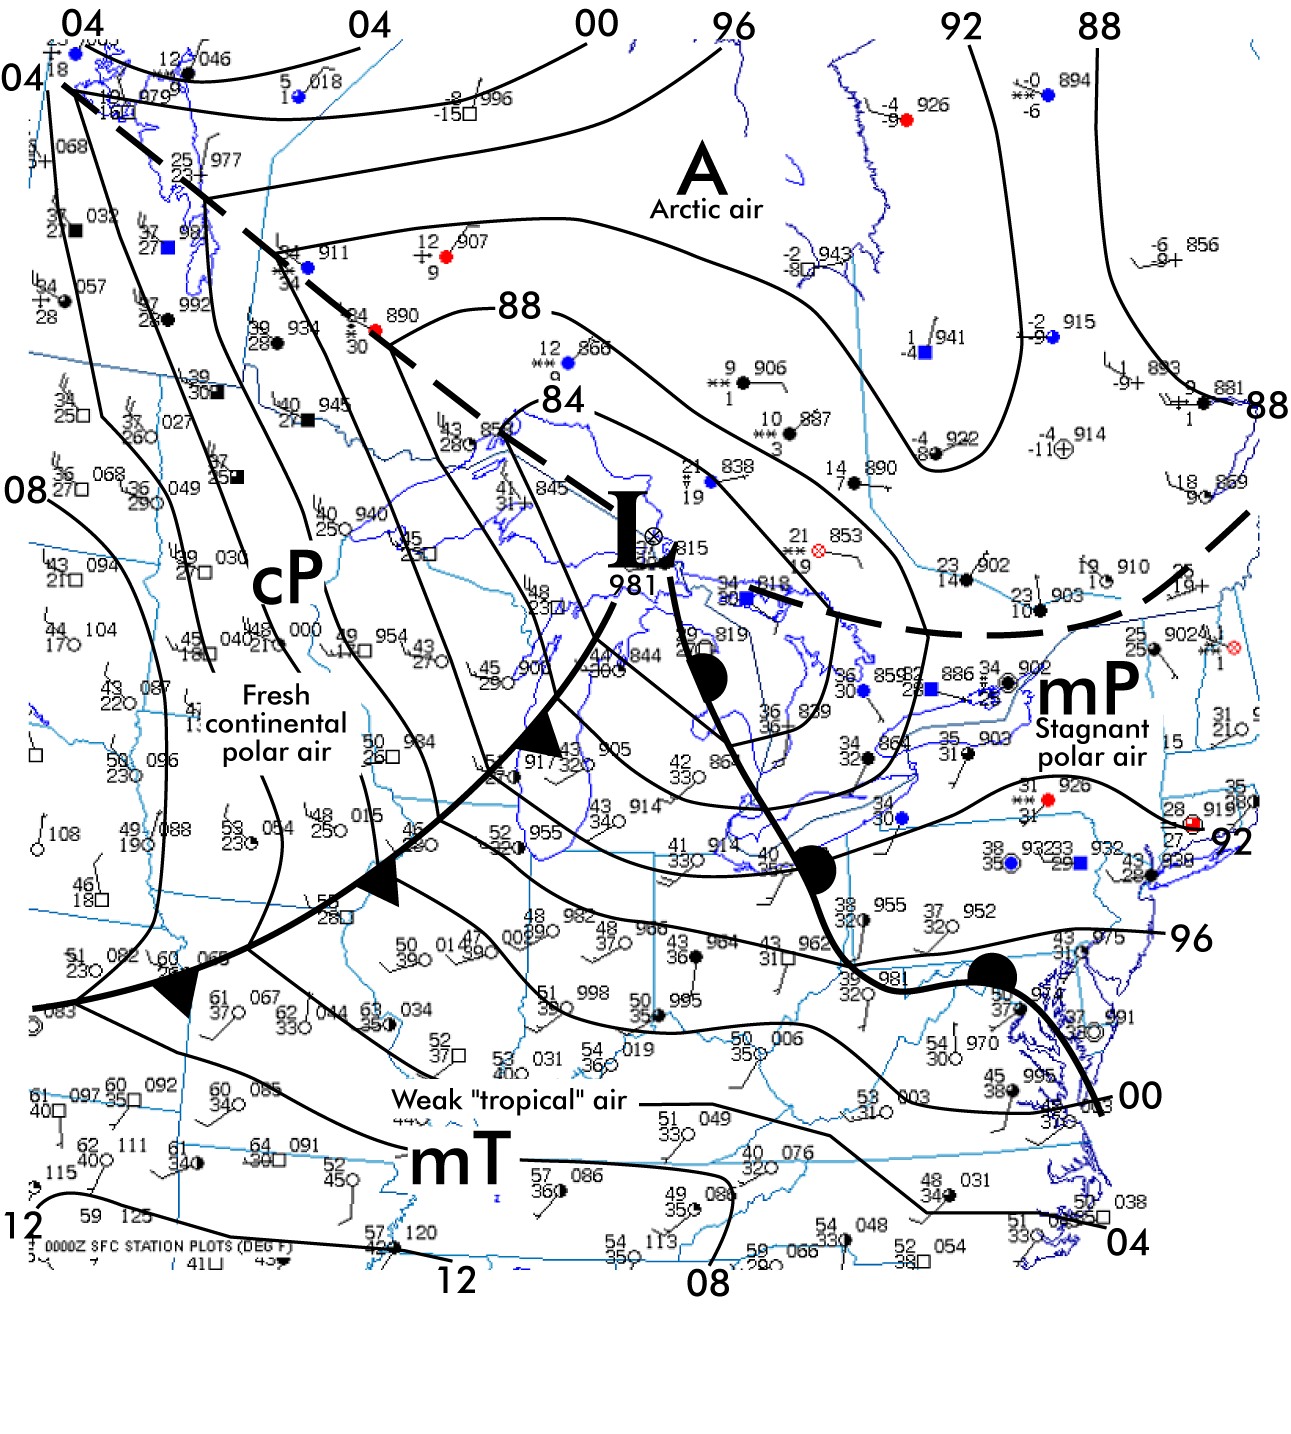
Draw isobars every four millibars (992, 996, 1000, 1004, etc.) using the plot model example at the lower right as a guide. As the plot model indicates, the actual millibar value for plotted pressure (xxx) is 10xx.x mb when the number shown is below 500, and 9xx.x when it is more than 500. For instance, 027 represents 1002.7 mb and 892 represents 989.2 mb. Therefore, when one station reports 074 and a nearby one shows 086, the 1008 mb isobar will be found halfway between the stations.

Click to enlarge

* * * * *
Scroll down for the solution
* * * * *
PART TWO: The Solution
This issue's puzzle, valid for January 8, 2003, illustrates an Alberta clipper. These systems are low pressure areas that develop in western Canada or Montana, sweeping rapidly eastward or southeastward and bringing fresh polar air behind them. The warm air mass the Alberta Clipper encounters usually consists of stagnating, modified air from a previous polar outbreak, rather than the deep tropical moisture usually encountered by cyclones originating from Texas and Colorado. Therefore these systems tend to be rather dry, and weather is limited to overcast clouds and a few weak showers.
The example shown is somewhat challenging to unravel because the surge of cold air behind the Alberta Clipper is rather mild. On first glance, many forecasters (the author included!) notice the sharp temperature difference and wind shift stretching across southern Ontario. This leads to the assumption that the polar front is in Ontario. However a cardinal rule of map analysis, which continues to be emphasized in the scientific literature, states that the polar front must be placed on the warm side of a large-scale temperature gradient.
With this rule in mind, closer scrutiny of the chart shows that this Canadian temperature gradient is part of a much larger gradient that reaches far south into the United States. For example, the mild 52-degree reading in Chicago contrasts sharply with the windy, 40-degree conditions in Duluth. The 63-degree reading in St. Louis contrasts with 43-degree northwesterly wind at Sioux Falls. Therefore the polar front is actually located in the central and northern United States. This distinction is important because the polar front itself serves as the main focus for surface and upper-level disturbances in the temperate latitudes. By ignoring the polar front's true location, a forecaster may miss the development of such features and the weather they cause.
Click to enlarge
©2003 Taylor & Francis
All rights reserved