Forecast Center
May/June 2003
by TIM VASQUEZ / www.weathergraphics.com
|
This article is a courtesy copy placed on the author's website for educational purposes as permitted by written agreement with Taylor & Francis. It may not be distributed or reproduced without express written permission of Taylor & Francis. More recent installments of this article may be found at the link which follows. Publisher's Notice: This is a preprint of an article submitted for consideration in Weatherwise © 2003 Copyright Taylor & Francis. Weatherwise magazine is available online at: http://www.informaworld.com/openurl?genre=article&issn=0043-1672&volume=56&issue=3&spage=58. |
PART ONE: The Puzzle
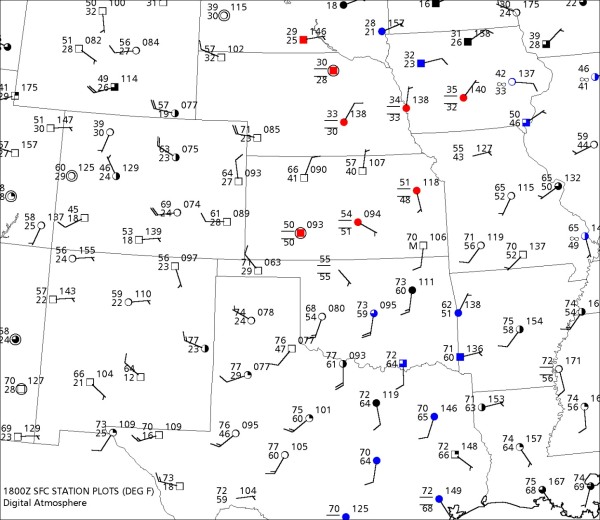
When springtime arrives, all eyes turn to the Great Plains. Across this windswept prairie, polar fronts no longer race southward but instead slow down and stagnate, serving as potent fuses waiting to be ignited by upper air systems originating from the Pacific. Once weather develops and thunderstorms blossom, patterns can become surprisingly complicated, challenging even the most seasoned forecaster. Tools like satellite imagery, profilers, and radar must be called on to get a proper three-dimensional understanding of what is happening in the atmosphere. However, even the simple weather systems are important weathermakers. For this issue we will look at the early afternoon weather chart for a simple springtime weather system and examine two special features familiar to forecasters in the central United States.
Draw isobars every four millibars (992, 996, 1000, 1004, etc.) using the plot model example at the lower right as a guide. As the plot model indicates, the actual millibar value for plotted pressure (xxx) is 10xx.x mb when the number shown is below 500, and 9xx.x when it is more than 500. For instance, 027 represents 1002.7 mb and 892 represents 989.2 mb. Therefore, when one station reports 074 and a nearby one shows 086, the 1008 mb isobar will be found halfway between the stations.

Click to enlarge

* * * * *
Scroll down for the solution
* * * * *
PART TWO: The Solution
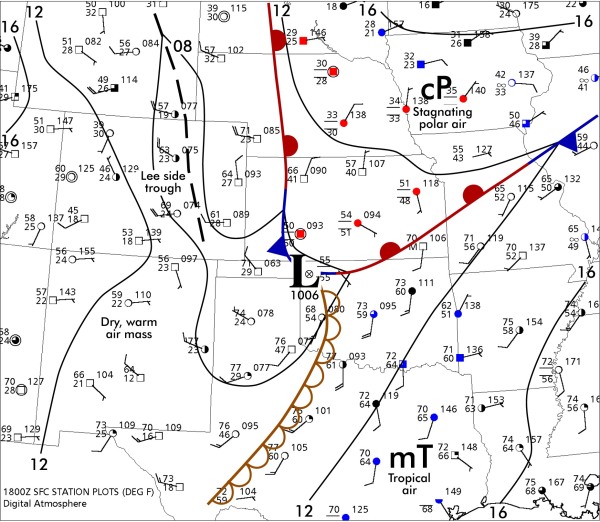
This issue's puzzle, valid for noon CST on March 12, 2003, shows a stagnating polar air mass over the northern Plains. Its edges are demarcated by fronts, which according to convention are found on the warm edge of zones with contrast in temperature. The presence of pressure troughs and wind shifts helps refine placement of the front. Finally, the question of whether the front is warm, cold, or stationary is determined by its movement. However when past maps are not available, as in this puzzle series, we make an assumption by studying the wind components across the boundary. For example in Nebraska the winds suggest a strong west-to-east component, which would push the front eastward. When warm air replaces cold air, a warm front is implied.
Most cold surges which blast southward through the Great Plains occupy thousands of feet of vertical depth and tend to deflect westward due to the Coriolis effect. As a result, they easily spread westward into Colorado and New Mexico, damming solidly against the Rocky Mountains and sometimes taking more than a week to erode. Easterly flow within the cold air mass forces the air to ascend from the lowest to the highest elevations of the Great Plains, resulting in adiabatic cooling, which in turn often produces low clouds and drizzle or light snow. It's not uncommon for Denver and Colorado Springs to be socked in with frigid temperatures, and airport delays while the intermountain ski resorts of Aspen and Breckenridge enjoy mild, sunny weather! However, today's cold surge presents a noteworthy exception. It's shallow and the pressures behind it are weak, therefore there is no chance of it reaching the western Great Plains and the Rocky Mountains. A nice forecast is on tap!
Another feature shown on the map is the lee-side trough. Lee-side troughs usually align parallel to and just downwind of the Front Range of the Rocky Mountains. They become sharply defined whenever a strong cross-mountain (westerly) component develops throughout the entire depth of the troposphere. Lee-side troughs are quite common during the transitional seasons of autumn and spring. Unusually warm weather due to downslope warming and very windy conditions are observed east of the mountains, along with the spectacular lenticular cloud displays that go on to win photo contests in Weatherwise. Some of Colorado's highest wind gusts have been observed during lee-side troughing patterns. The trough usually remains stationary and weakens when the upper level winds die off or a strong polar air mass invades and masks its presence.
The feature in Texas drawn with bubbles along its entire length is the dryline. The dryline is simply a boundary that separates moist, tropical air from dry, warm intermountain air. It graces weather charts on half of all spring days, especially in western parts of Texas and Kansas. Note the sharp difference in dewpoint temperatures across its length. This is the sole characteristic of a dryline, and it does not need to be found in a pressure trough as fronts do. Since it is often a focus for low-level convergence, weaker capping, and best proximity of rich moisture to upper-level disturbances emerging from the Rockies, the dryline often serves as an axis for severe thunderstorm development. During the day, a dryline almost always advances towards the moist air at speed inversely proportional to the depth of tropical air it moves into. At night, it retreats westward into the dry air. This curious quality, sometimes referred to as "sloshing", is a predictable pattern that takes away some of the uncertainty faced by meteorologists and storm chasers during the complicated months of spring.

Click to enlarge
©2003 Taylor & Francis
All rights reserved