Forecast Center
July/August 2003
by TIM VASQUEZ / www.weathergraphics.com
|
This article is a courtesy copy placed on the author's website for educational purposes as permitted by written agreement with Taylor & Francis. It may not be distributed or reproduced without express written permission of Taylor & Francis. More recent installments of this article may be found at the link which follows. Publisher's Notice: This is a preprint of an article submitted for consideration in Weatherwise © 2003 Copyright Taylor & Francis. Weatherwise magazine is available online at: http://www.informaworld.com/openurl?genre=article&issn=0043-1672&volume=56&issue=4&spage=58. |
PART ONE: The Puzzle
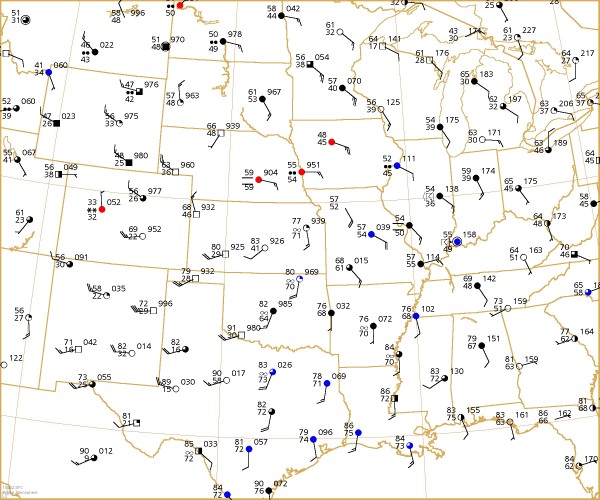
It is just after lunchtime on a Sunday in May. A big outbreak of severe weather is expected somewhere in the central United States during the next six hours. National Weather Service statements take on a grave tone. The Weather Channel's severe weather expert has been on the air all morning. There is talk of storm chasers taking to the roads en masse. If you are up to the challenge, try to pinpoint where this outbreak will occur!
Draw isobars every four millibars (992, 996, 1000, 1004, etc.) using the plot model example at the lower right as a guide. As the plot model indicates, the actual millibar value for plotted pressure (xxx) is 10xx.x mb when the number shown is below 500, and 9xx.x when it is more than 500. For instance, 027 represents 1002.7 mb and 892 represents 989.2 mb. Therefore, when one station reports 074 and a nearby one shows 086, the 1008 mb isobar will be found halfway between the stations.

Click to enlarge

* * * * *
Scroll down for the solution
* * * * *
PART TWO: The Solution
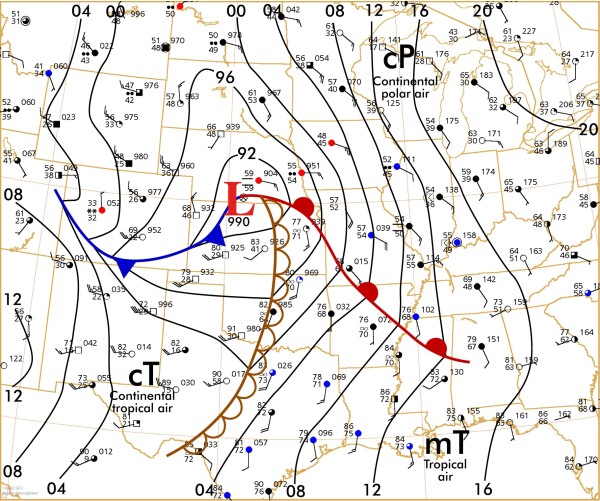
This issue's puzzle is for 1 pm CDT on May 4, 2003, a red-letter day in severe weather history. At least five tornadoes touched down in the Kansas City area during the evening. The worst tornadoes were ranked F4 on the Fujita damage scale. Other tornadoes plowed through southern Missouri and on into Tennessee. The final death toll would reach close to 40 lives.
However the severe weather didn't stop there. This system and a succession of new disturbances and surface lows following in its footsteps together produced an astounding 384 tornadoes during the next seven days. According to the National Weather Service, this spell of severe weather decimated all previous records for the most tornadoes in a week, eclipsing a modest record set in May 1995.
A very deep surface low approaching the threat area is often a key culprit in prolific outbreaks such as this one. First, deep lows create long fetches of southerly surface winds that tap the heart of tropical moisture from the Caribbean. Such moisture yields the best possible instability for thunderstorms. Second, they create long fetches of southwesterly mid-level winds that bring warm desert plateau air into the threat area, creating a "cap" that delays thunderstorms, bottling up instability until enough solar heating has warmed the threat area. Third, these deep low pressure areas create strong contrasts in wind direction. Strong easterly winds at the surface contrasting with southwesterly winds aloft often creates the ideal shear profile needed to produce rotating storms.
Using the puzzle solution, the key to pinpointing the location of severe weather is to consider the building blocks of a thunderstorm: instability, moisture, and lift, with shear serving as an extra building block for a severe thunderstorm. Using the surface chart we estimate instability and moisture together by finding where the highest temperature, and especially dewpoint values, penetrate northward. This is found in eastern Kansas: the station reporting a temperature of 77 and a dewpoint of 71 stands out prominently from the stations to its west, north, and east.
Using the surface chart, lift is found along any front, especially where isobars are kinked sharply. This indicates low-level convergence, which causes air to rise. Lift is also found in regions where winds at two or more stations seem to "come together". The excellent instability in Kansas, for example, is located near a warm front, which is a source of lift.
Finally, shear is important for persistent, rotating storms. Shear can be located where surface winds are in strongest opposition to the southwesterly or westerly winds aloft. For example, the air over west Texas suggests poor shear, while the easterly winds in Missouri imply strong shear. It can be seen that the best shear is probably over much of Missouri, Iowa, and Kansas.
Of course, National Weather Service forecasters have a whole range of charts to help them narrow down threat areas. A sounding, constant pressure chart, or a profiler plot is never ignored. However it should be obvious that the surface chart is a gold mine for anyone wanting to forecast severe weather. In fact, it is quite literally where the hunt begins!

Click to enlarge
©2003 Taylor & Francis
All rights reserved