Forecast Center
November/December 2003
by TIM VASQUEZ / www.weathergraphics.com
|
This article is a courtesy copy placed on the author's website for educational purposes as permitted by written agreement with Taylor & Francis. It may not be distributed or reproduced without express written permission of Taylor & Francis. More recent installments of this article may be found at the link which follows. Publisher's Notice: This is a preprint of an article submitted for consideration in Weatherwise © 2003 Copyright Taylor & Francis. Weatherwise magazine is available online at: http://www.informaworld.com/openurl?genre=article&issn=0043-1672&volume=56&issue=6&spage=66. |
PART ONE: The Puzzle
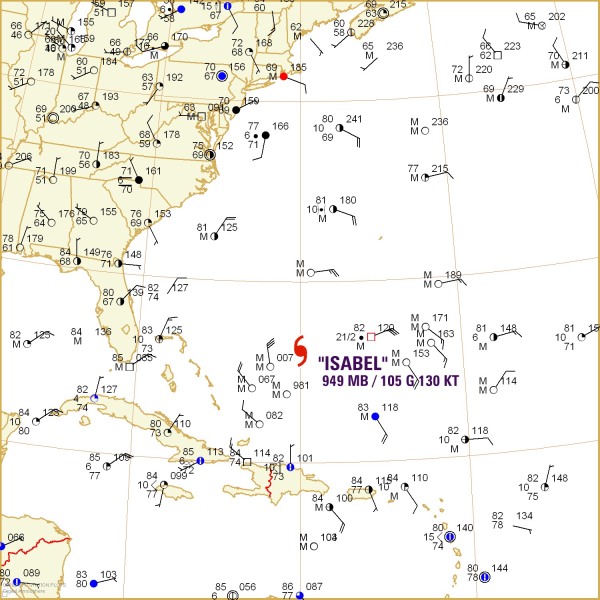
Fall is a busy time in the subtropical regions. The ocean temperatures reach their warmest readings, and this sets the stage for runaway development of vast storms with incredibly low pressures. These systems, called tropical cyclones, are known regionally as hurricanes in the Americas, typhoons in east Asia, and cyclones in the Indian Ocean. However, all of them are exactly identical. In this example we'll take a look at Hurricane Isabel as it appeared on September 15.
Draw isobars every four millibars (992, 996, 1000, 1004, etc.) using the plot model example at the lower right as a guide. As the plot model indicates, the actual millibar value for plotted pressure (xxx) is 10xx.x mb when the number shown is below 500, and 9xx.x when it is more than 500. For instance, 027 represents 1002.7 mb and 892 represents 989.2 mb. Therefore, when one station reports 074 and a nearby one shows 086, the 1008 mb isobar will be found halfway between the stations.

Click to enlarge

* * * * *
Scroll down for the solution
* * * * *
PART TWO: The Solution
Hurricane Isabel was one of the strongest storms of the 2003 season. It reached category five, the highest possible rating on the Saffir-Simpson scale, with winds reaching 160 mph. A category of this magnitude had not been seen in the Atlantic basin since Hurricane Mitch, which in 1998 struck Central America.
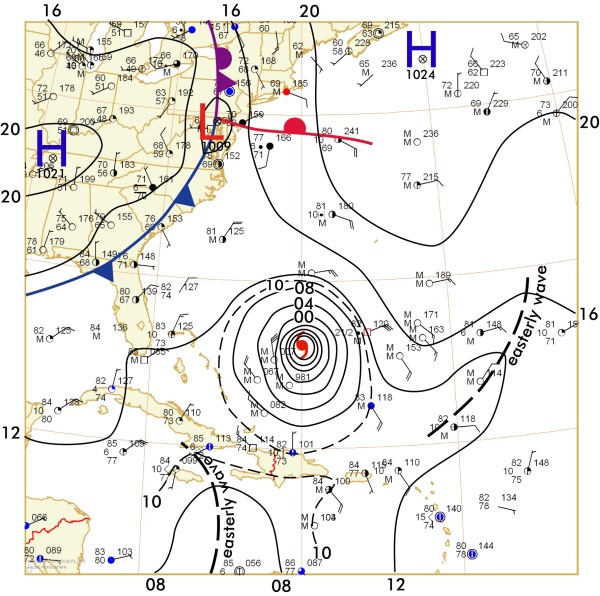
A surface analysis shows the shape and extent of the storm. The storm's size is indicated by the diameter covered by the largest closed isobar, in other words, the isobar that forms a complete ring around the storm. In this example, an intermediate isobar of 1010 mb was drawn to illustrate the widest possible closed isobar on the map. A 1011 mb isobar, by contrast, would not be a closed isobar in this example. It can be seen that the 1010 mb closed isobar spans a size of 10 degrees of latitude. Since one degree of latitude equals 60 nautical miles (nm), this indicates that Isabel's size was 600 nm, or 690 statute miles. This may seem vast, but the deepest tropical storm ever recorded on Earth, Supertyphoon Tip in August 1979, spanned the incredible diameter of nearly 1400 miles.
Though the size of Isabel may be impressive, most of the isobars show only a light cyclonic circulation. The damaging winds that characterize the hurricane are confined to a very small area around the storm. It comes as no surprise, as hurricane-force winds rarely extend more than about 100 miles from a storm's center.
What behavior can be expected for Hurricane Isabel? Intensification trends are suggested partly by sea-surface temperatures, which can be monitored using data from buoys, ships, and satellites. A very warm water temperature supports development. Speed of movement is usually a reflection of the mean wind component outside of the storm's closed isobars. However, direction comprises the toughest part of the forecast. Patterns illustrated on the surface chart are important. In this example, a frontal system is sweeping across the east coast of the United States. Recurvature of a hurricane northward is favored when the storm is in proximity to a frontal system, suggesting that the Carolinas are more threatened than Florida. On the other hand, in an instance where high pressure flanks all of the storm's northern periphery, a hurricane will drift further west before recurving north.
Elsewhere, two easterly waves are located, one over the middle Atlantic and another near Jamaica. Easterly waves are troughs embedded in the easterly trade winds. They move westward, bringing clouds and often showery weather. Depending on the sea surface temperature, wind shear, and Coriolis effect, easterly waves may deepen into tropical cyclones. Most Atlantic hurricanes are the result of easterly waves departing the west African coast and strengthening. Every day, tropical meteorologists monitor easterly waves, watching for the slightest indications of development, if not merely for the beneficial rains they bring to the tropics.

Click to enlarge
©2003 Taylor & Francis
All rights reserved