Forecast Center
January/February 2004
by TIM VASQUEZ / www.weathergraphics.com
|
This article is a courtesy copy placed on the author's website for educational purposes as permitted by written agreement with Taylor & Francis. It may not be distributed or reproduced without express written permission of Taylor & Francis. More recent installments of this article may be found at the link which follows. Publisher's Notice: This is a preprint of an article submitted for consideration in Weatherwise © 2004 Copyright Taylor & Francis. Weatherwise magazine is available online at: http://www.informaworld.com/openurl?genre=article&issn=0043-1672&volume=57&issue=1&spage=66. |
PART ONE: The Puzzle
When winter arrives, it's the snowstorms which grab the headlines. However, cold waves are just as important. Not only do they shape the day-to-day lives of millions of people, but they have a great effect upon agriculture, construction, and the petroleum industry. This issue's puzzle takes us to the core of the cold snap: the polar air mass. One hint: no fronts will be found!
Draw isobars every four millibars (992, 996, 1000, 1004, etc.) using the plot model example at the lower right as a guide. As the plot model indicates, the actual millibar value for plotted pressure (xxx) is 10xx.x mb when the number shown is below 500, and 9xx.x when it is more than 500. For instance, 027 represents 1002.7 mb and 892 represents 989.2 mb. Therefore, when one station reports 074 and a nearby one shows 086, the 1008 mb isobar will be found halfway between the stations.
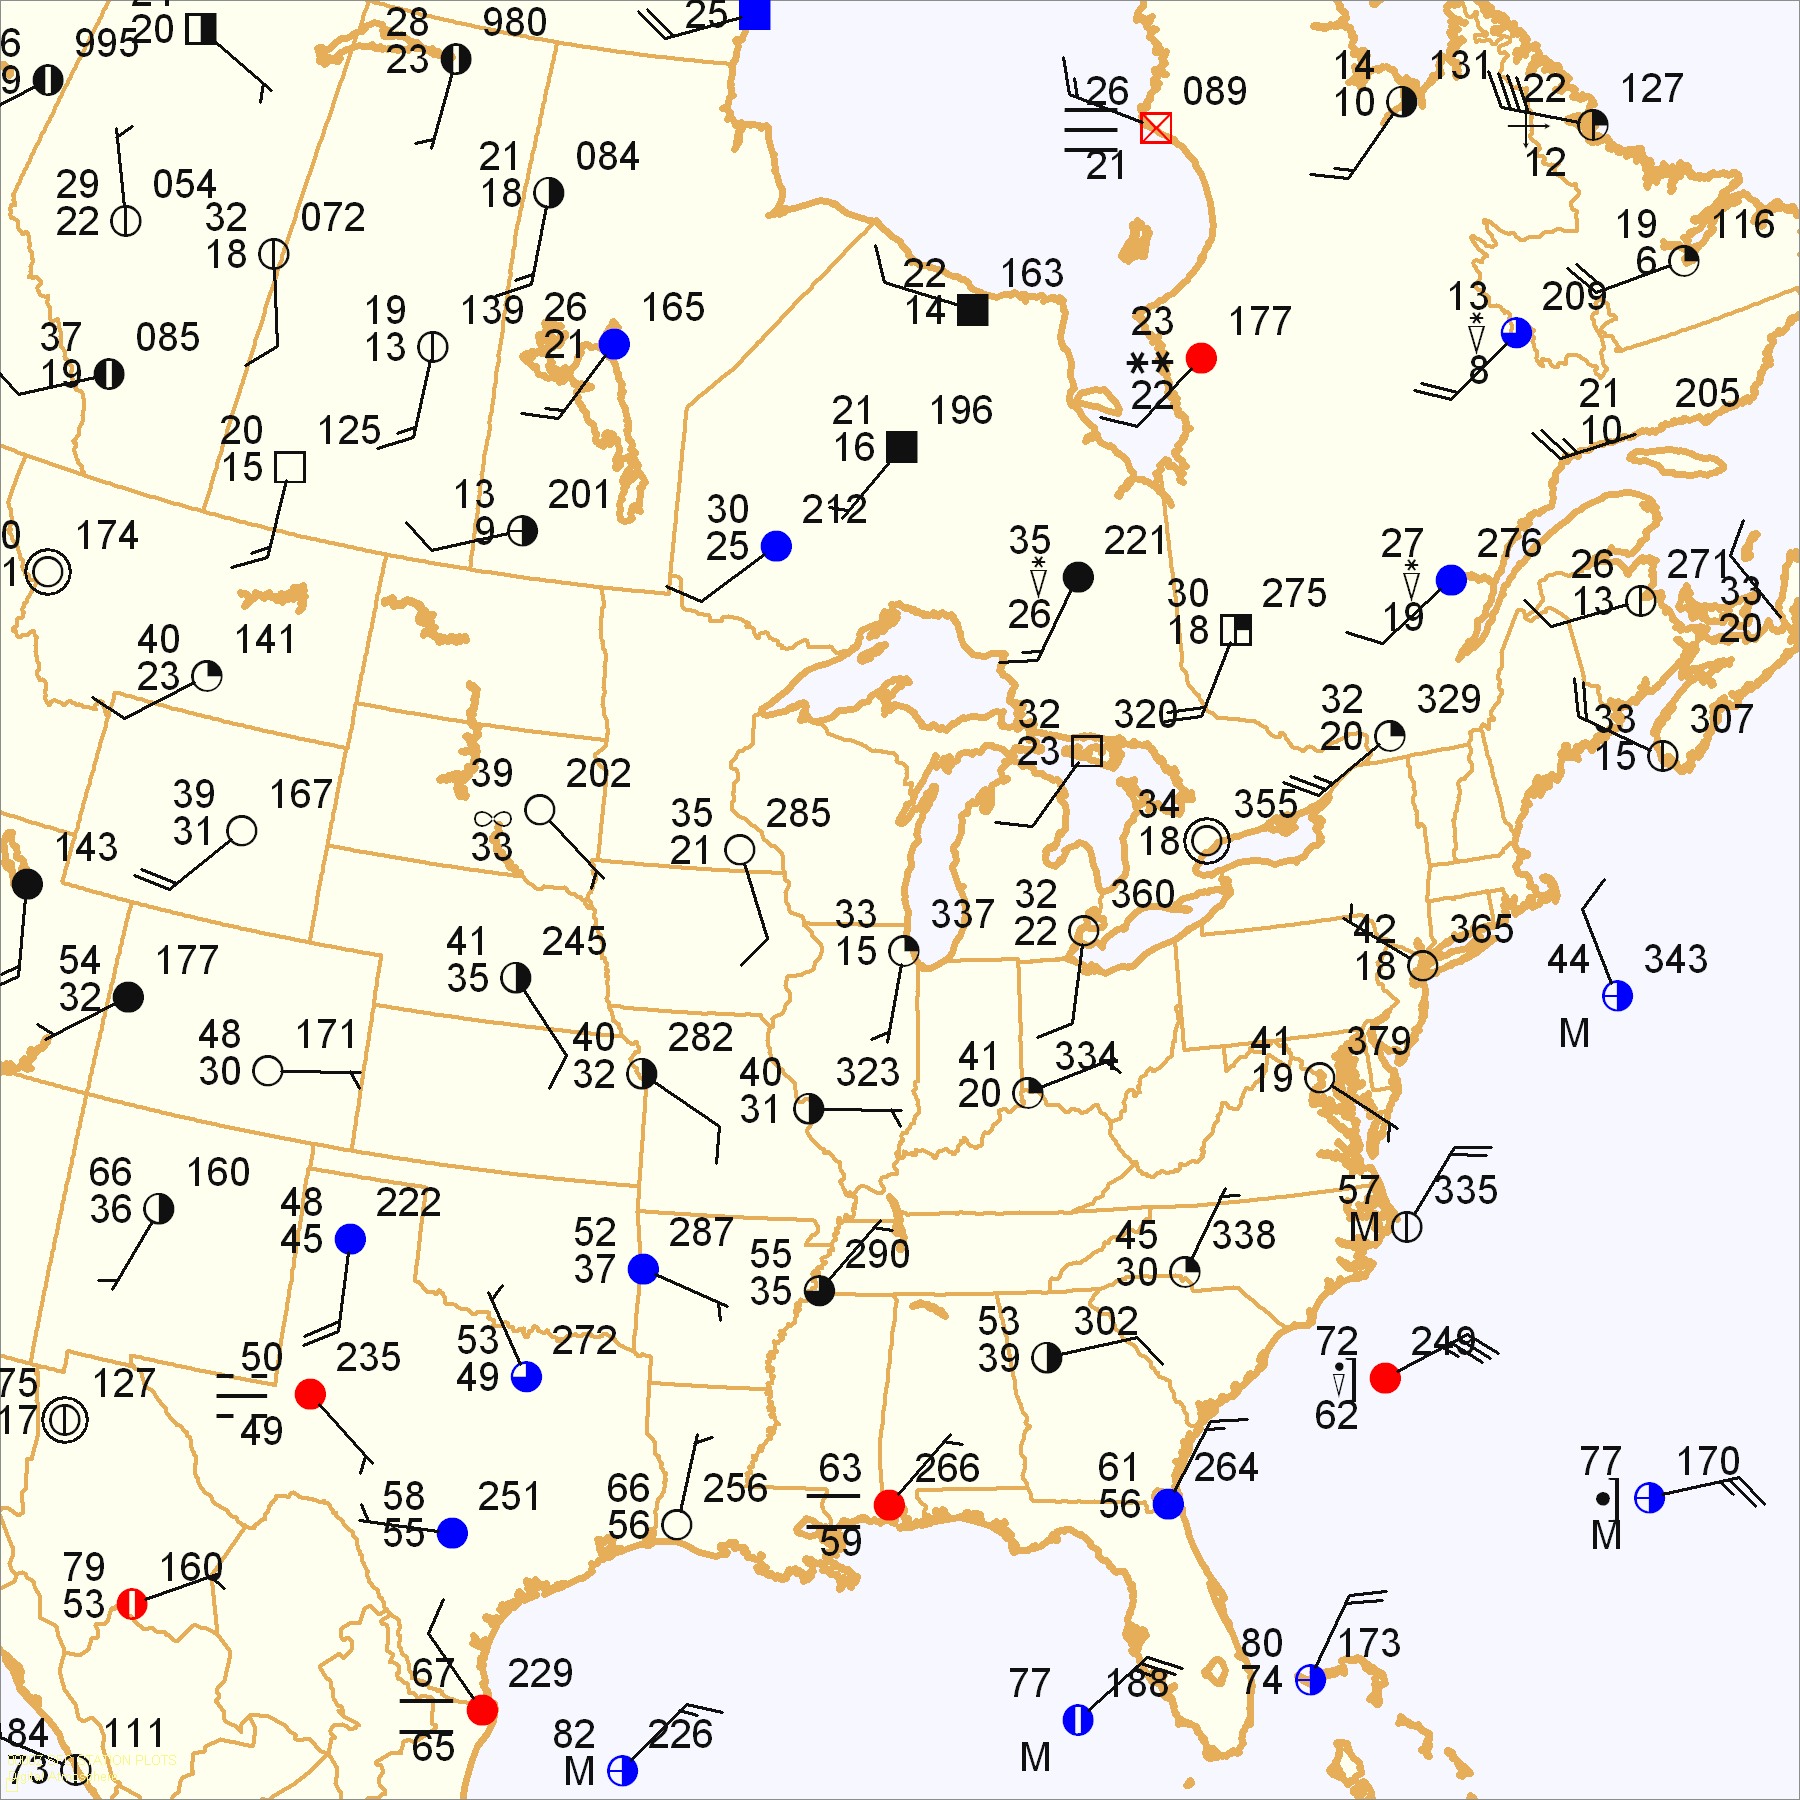
Click to enlarge

* * * * *
Scroll down for the solution
* * * * *
PART TWO: The Solution
The surface chart on November 9, 2003 shows an early-season polar high which has left its source region and spread throughout much of the United States, bringing wintry weather. These cold air masses typically develop over Canada, particularly in northern latitudes. The recipe for a cold air mass is quite simple: radiate all the heat away into space and insulate the air from below! Several inches of fresh snow, clear skies, and a long winter night form the ideal setting.
Left undisturbed for a few nights, such an air mass can reach incredibly frigid temperatures through hundreds or thousands of feet of depth. The longer it remains in place, the stronger the cold air mass becomes. Barometer readings climb as the column of air above the station becomes denser and denser. A large high pressure area builds, and on weather charts it may span hundreds or even thousands of miles in diameter.
Exceptionally cold air masses are often so dense that they begin expanding southward without any mechanism to actually dislodge them. However, more often, the southern fringes of the cold air mass form a sharp contrast with warmer air further to the south, creating a setup known as baroclinic instability. This may lead to development of a frontal system south of the high whose circulation draws cold air into its back side. Eventually the entire air mass is drawn southward or southeastward, covering much of the United States in the wake of the frontal system. Here the air mass stagnates, warming from below, and its central pressures fall. Eventually it loses definition on the surface charts, spreading into the southeastern states and the Atlantic basin, and disappears from the charts.
The eastern half of a high pressure area is associated with cold, northerly flow in the wake of a cold front. This brings good weather, except when the cold air destabilizes by passing over warm, moist surfaces such as the Great Lakes and the Gulf Stream. The western half of the high presure is associated with warm southerly flow. This is sometimes called return flow, implying the inevitable return of warm air after it has been driven out. The return flow of warm air over a cold air mass results in lift (sometimes called "overrunning"), which may produce stratiform clouds and sometimes precipitation. A special technique called isentropic analysis helps forecasters anticipate this kind of lift.
From a forecasting perspective, it is most important to monitor polar highs while they are still in their source regions. Here they are small and weak, but surface charts will pinpoint the degree of cooling which is occurring, while upper air soundings will reveal the depth of the cold air. Other clues can indicate whether the cooling, and further building of the high, will continue. The deeper and colder the air mass, the greater the likelihood that a brutal cold wave will affect the southern Canada and the United States in the days ahead!
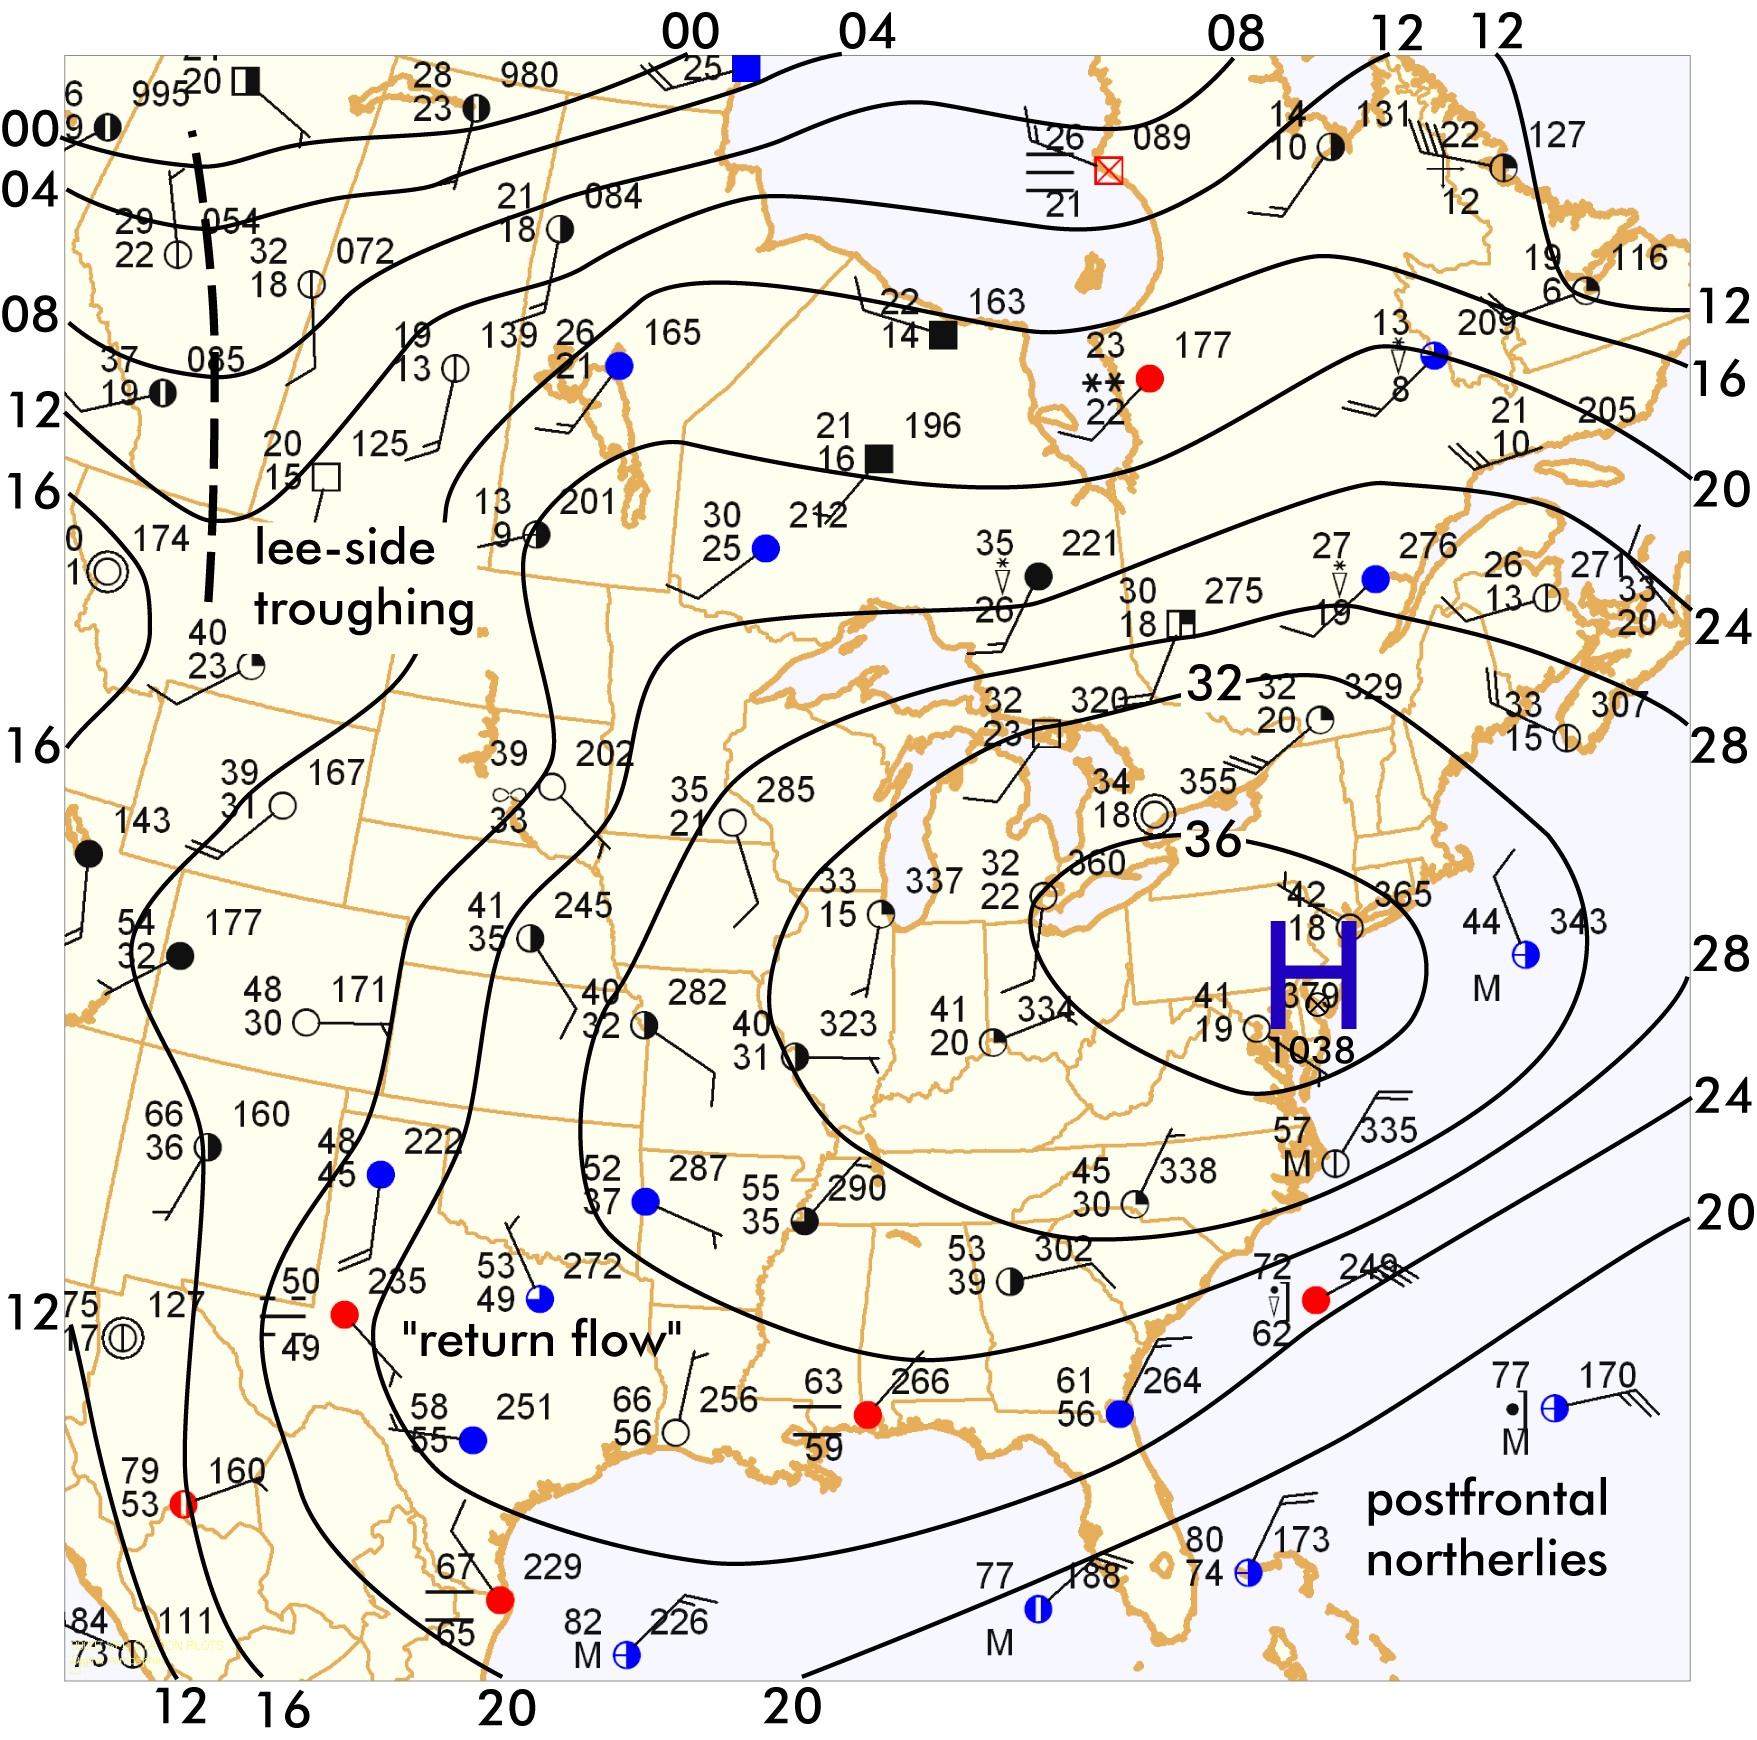
Click to enlarge
©2004 Taylor & Francis
All rights reserved