Forecast Center
July/August 2004
by TIM VASQUEZ / www.weathergraphics.com
|
This article is a courtesy copy placed on the author's website for educational purposes as permitted by written agreement with Taylor & Francis. It may not be distributed or reproduced without express written permission of Taylor & Francis. More recent installments of this article may be found at the link which follows. Publisher's Notice: This is a preprint of an article submitted for consideration in Weatherwise © 2004 Copyright Taylor & Francis. Weatherwise magazine is available online at: http://www.informaworld.com/openurl?genre=article&issn=0043-1672&volume=57&issue=4&spage=82. |
PART ONE: The Puzzle
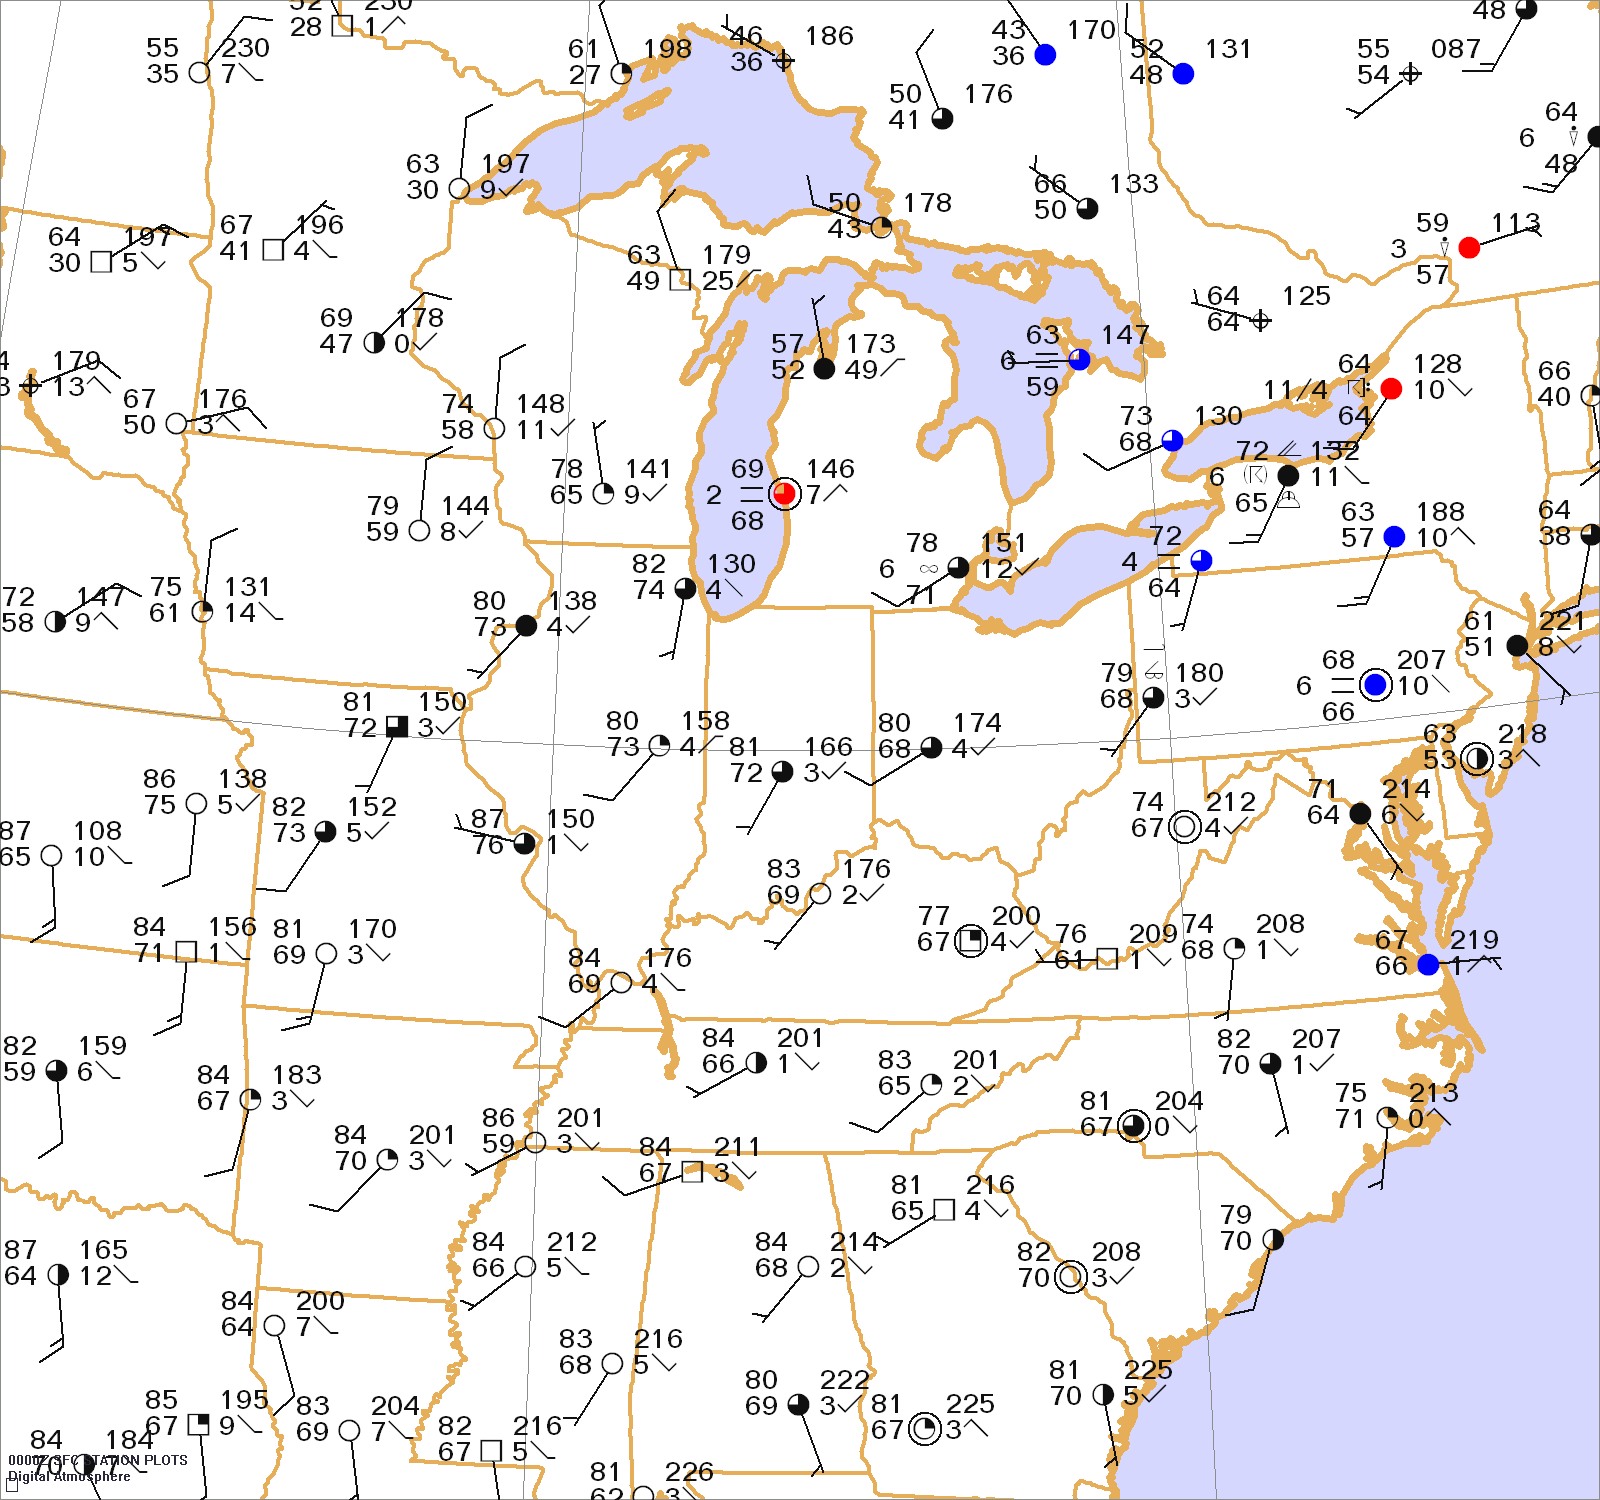
In May, all eyes are on the Great Plains. Storm chasers ply the back roads of Kansas and Nebraska, and footage of tornadoes regularly makes the evening news. However not all the springtime action centers in this part of the country. This issue's puzzle examines an unusual situation in the Midwestern states. Moisture patterns, indicated by the dewpoint values, will yield some important clues.
Draw isobars every four millibars (992, 996, 1000, 1004, etc.) using the plot model example at the lower right as a guide. As the plot model indicates, the actual millibar value for plotted pressure (xxx) is 10xx.x mb when the number shown is below 500, and 9xx.x when it is more than 500. For instance, 027 represents 1002.7 mb and 892 represents 989.2 mb. Therefore, when one station reports 074 and a nearby one shows 086, the 1008 mb isobar will be found halfway between the stations.
Click to enlarge

* * * * *
Scroll down for the solution
* * * * *
PART TWO: The Solution
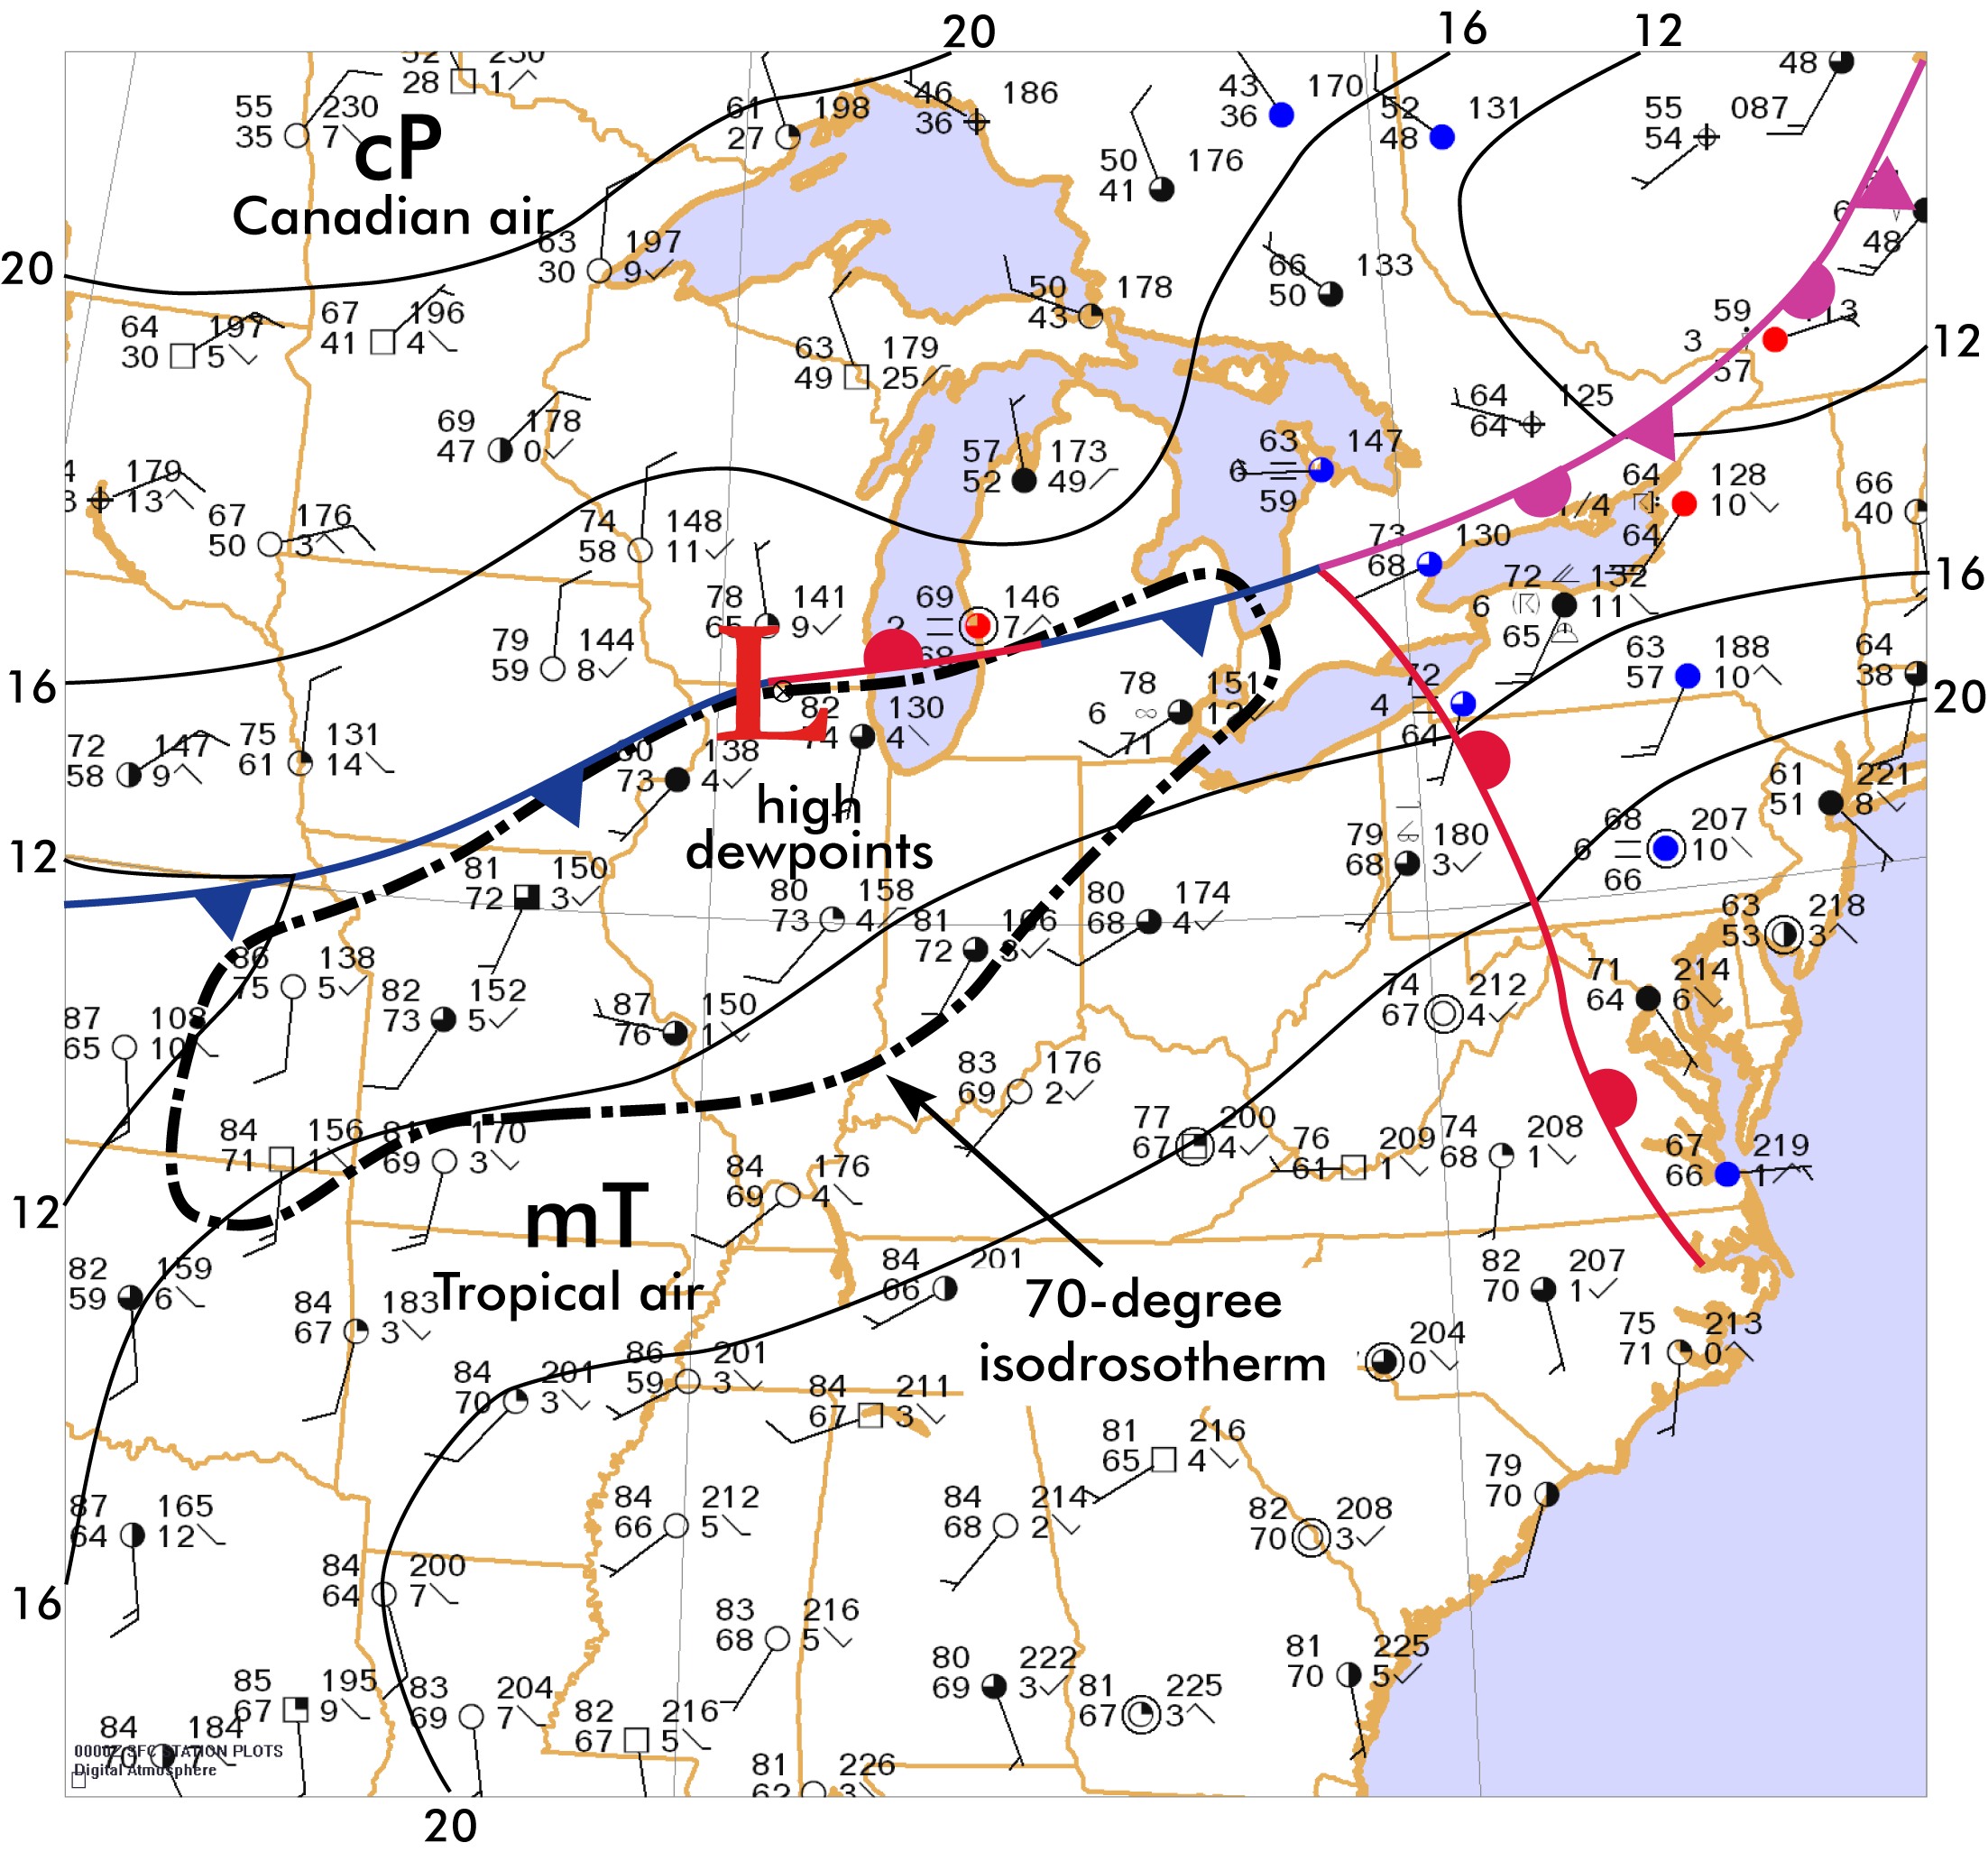
The afternoon of May 21, 2004 brought an unusual amount of moisture to the Great Lakes region. Chicago sweltered with a 74-degree dewpoint, while residents of Detroit fared only a little better at 71 degrees. For the northern United States, such dewpoint readings are considered very high, comparable to what Houston and San Antonio experience in the middle of August.
A dewpoint temperature is a direct indication of the air's moisture content. The higher it is, the greater the moisture, and the greater the air's potential to be buoyant and produce clouds. If atmospheric conditions are right, buoyant air can result in thunderstorms. To determine exactly what will happen, forecasters relate the low-level air temperature, and especially the dewpoint temperature, to the upper-level temperatures. The greater the difference between the low-level and upper-level temperatures, the higher the instability. During the spring season upper-level temperatures are still quite cool, not yet reaching their August peak, so with very high dewpoints in the Great Lakes region the stage is certainly set for severe thunderstorms.
Where will the storms be? The completed surface analysis helps greatly by showing cold and warm fronts. These fronts demarcate areas of convergence, where winds come together and can produce rising motion. South of fronts the air generally lacks a focusing mechanism, while north of fronts the air often lacks the moisture needed for storms. The region along the fronts and other boundaries, and especially near low pressure, are where winds converge and provide the best conditions for storm development. A weak low pressure area on the front can be found at Chicago, which reports a low reading of 1013.0 mb, and this suggests thunderstorms are most likely near Chicago.
At the time of this analysis, severe thunderstorms were in progress across northern Illinois and southern Wisconsin. Within hours, they moved across Lake Michigan, following the surface front and causing extensive damage throughout Michigan. Over 250,000 residents were without power, and widespread flooding was reported. More storms formed along the front by the next afternoon, producing even more devastation.
Click to enlarge
©2004 Taylor & Francis
All rights reserved