Forecast Center
November/December 2004
by TIM VASQUEZ / www.weathergraphics.com
|
This article is a courtesy copy placed on the author's website for educational purposes as permitted by written agreement with Taylor & Francis. It may not be distributed or reproduced without express written permission of Taylor & Francis. More recent installments of this article may be found at the link which follows. Publisher's Notice: This is a preprint of an article submitted for consideration in Weatherwise © 2004 Copyright Taylor & Francis. Weatherwise magazine is available online at: http://www.informaworld.com/openurl?genre=article&issn=0043-1672&volume=57&issue=6&spage=90. |
PART ONE: The Puzzle
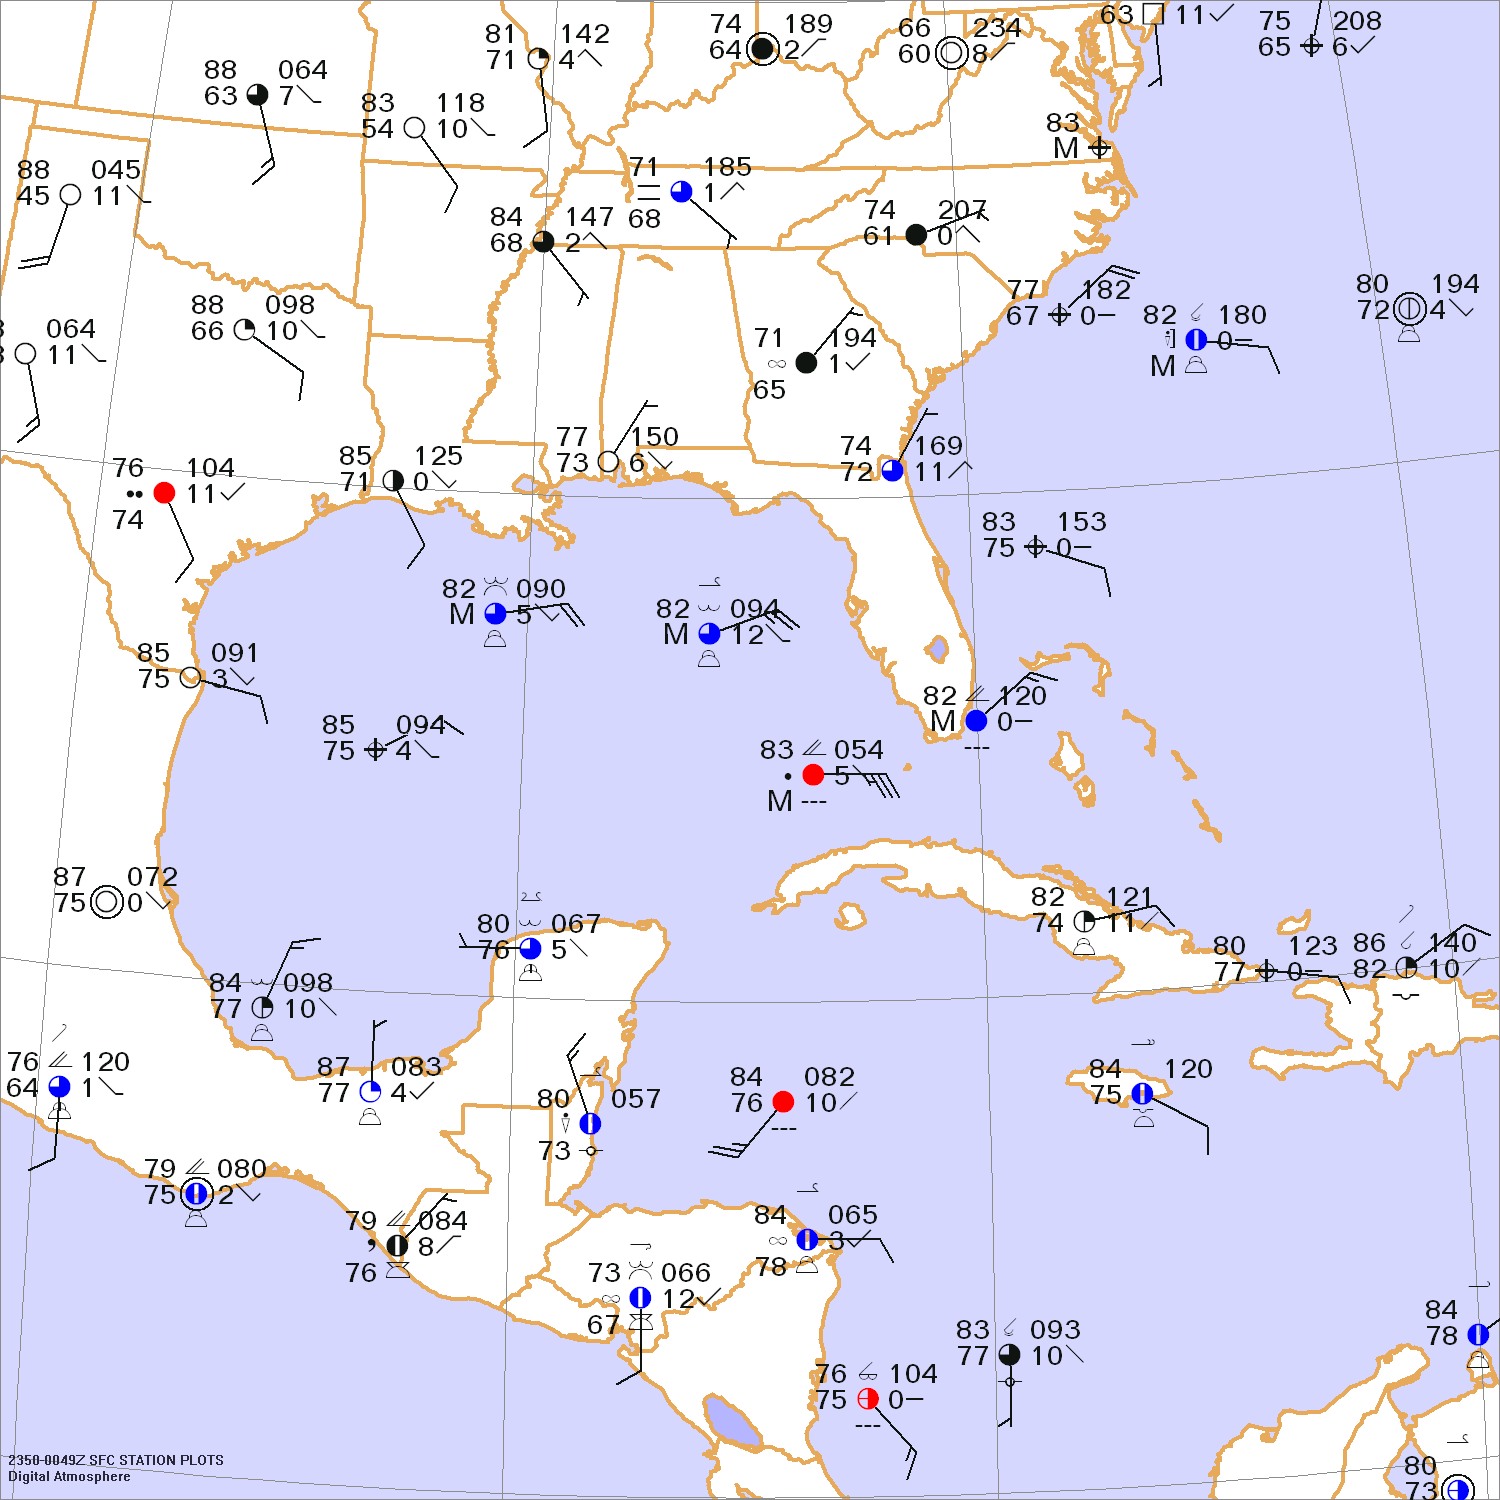
A strong hurricane has been reported, and your job will be to locate it without the help of radar or satellite! During the first half of the 20th century, radar and satellite observations were not available. Chart analysis was the key to tracking tropical storms and hurricanes. While a smorgasbord of tools are available nowadays, surface charts still play a pivotal role in defining the environment of tropical weather systems and projecting their movement.
The most helpful tool for tropical weather analysis is streamline analysis. This is because in the lower latitudes pressure systems are very weak, and as a result barometer readings tend to be dominated by diurnal heating and terrain effects. Streamlines are very simple: they are long lines, drawn freehand, that are parallel with the wind direction. They may merge smoothly with each other, but may not cross one another or form intersections. Enough streamlines should be drawn to get a detailed representation of the wind flow across the chart.
In this puzzle, draw streamlines and locate important weather features, including the hurricane. For further information, along with helpful hints and advice, visit << http://www.weathergraphics.com/edu >>
Click to enlarge

* * * * *
Scroll down for the solution
* * * * *
PART TWO: The Solution
As you may have discovered, streamlines are simple. Many forecasters find them easier to do than isobars, as numbers on the chart don't need to be read continuously. However it can be challenging to fine-tune the streamlines where winds in a localized area are in different directions or are complicated. It's not hard, but it does take practice.
A surface streamline analysis often shows zones of confluence and difluence. Confluent zones, where streamlines are coming together, are an indicator of possible convergence, which is associated with lift, clouds and rain. Likewise difluence zones indicate possible divergence, associated with subsidence and fair weather. Streamlines that form an axis of confluence or difluence are called asymptotes.
Streamline charts frequently show neutral points, locations where air comes together from opposite directions, and then moves away to the left and the right. At a neutral point the confluence negates the difluence, so weather is indeterminate. This puzzle, for example, shows one neutral point. The chart may also show cusps and waves, as well as a vortex, which was clearly revealed in this puzzle. This vortex was Hurricane Ivan.
On the evening of September 13, 2004, Ivan was grazing western Cuba. It was a Category 5 storm on the Saffir-Simpson scale, with winds of 140 kt gusting to 170 kt (160 mph gusting to 195 mph). It was also the sixth most intense storm on record in terms of barometric pressure. The streamline analysis shows that it was embedded in a broad region of easterly winds (trade winds), and had a circulation which spanned hundreds of miles. It had prominent areas of confluent flow to its south and east, which were probably associated with stronger lift and precipitation bands spiralling into the storm.
In weaker weather patterns, streamline analysis is a vital tool for tracking weather disturbances such as easterly waves and decaying fronts. Even in temperate latitudes, streamline analysis is useful on severe weather days to help find zones of low-level convergence. Like many analysis tools, it is often overlooked in this era of computer power and numerical models, but quite often it proves to be the perfect tool for the perfect forecast. From my own experience, I guarantee it.

Click to enlarge
©2004 Taylor & Francis
All rights reserved