Forecast Center
March/April 2005
by TIM VASQUEZ / www.weathergraphics.com
|
This article is a courtesy copy placed on the author's website for educational purposes as permitted by written agreement with Taylor & Francis. It may not be distributed or reproduced without express written permission of Taylor & Francis. More recent installments of this article may be found at the link which follows. Publisher's Notice: This is a preprint of an article submitted for consideration in Weatherwise © 2005 Copyright Taylor & Francis. Weatherwise magazine is available online at: http://www.informaworld.com/openurl?genre=article&issn=0043-1672&volume=58&issue=2&spage=82. |
PART ONE: The Puzzle
Winter is typically a quiet time on Great Plains. Dry, cold weather alternates every few days with Alberta clippers and outbreaks of cold air from Canada. However when organized Pacific weather systems traverse the Rockies, major snowstorms and ice events make the headlines.
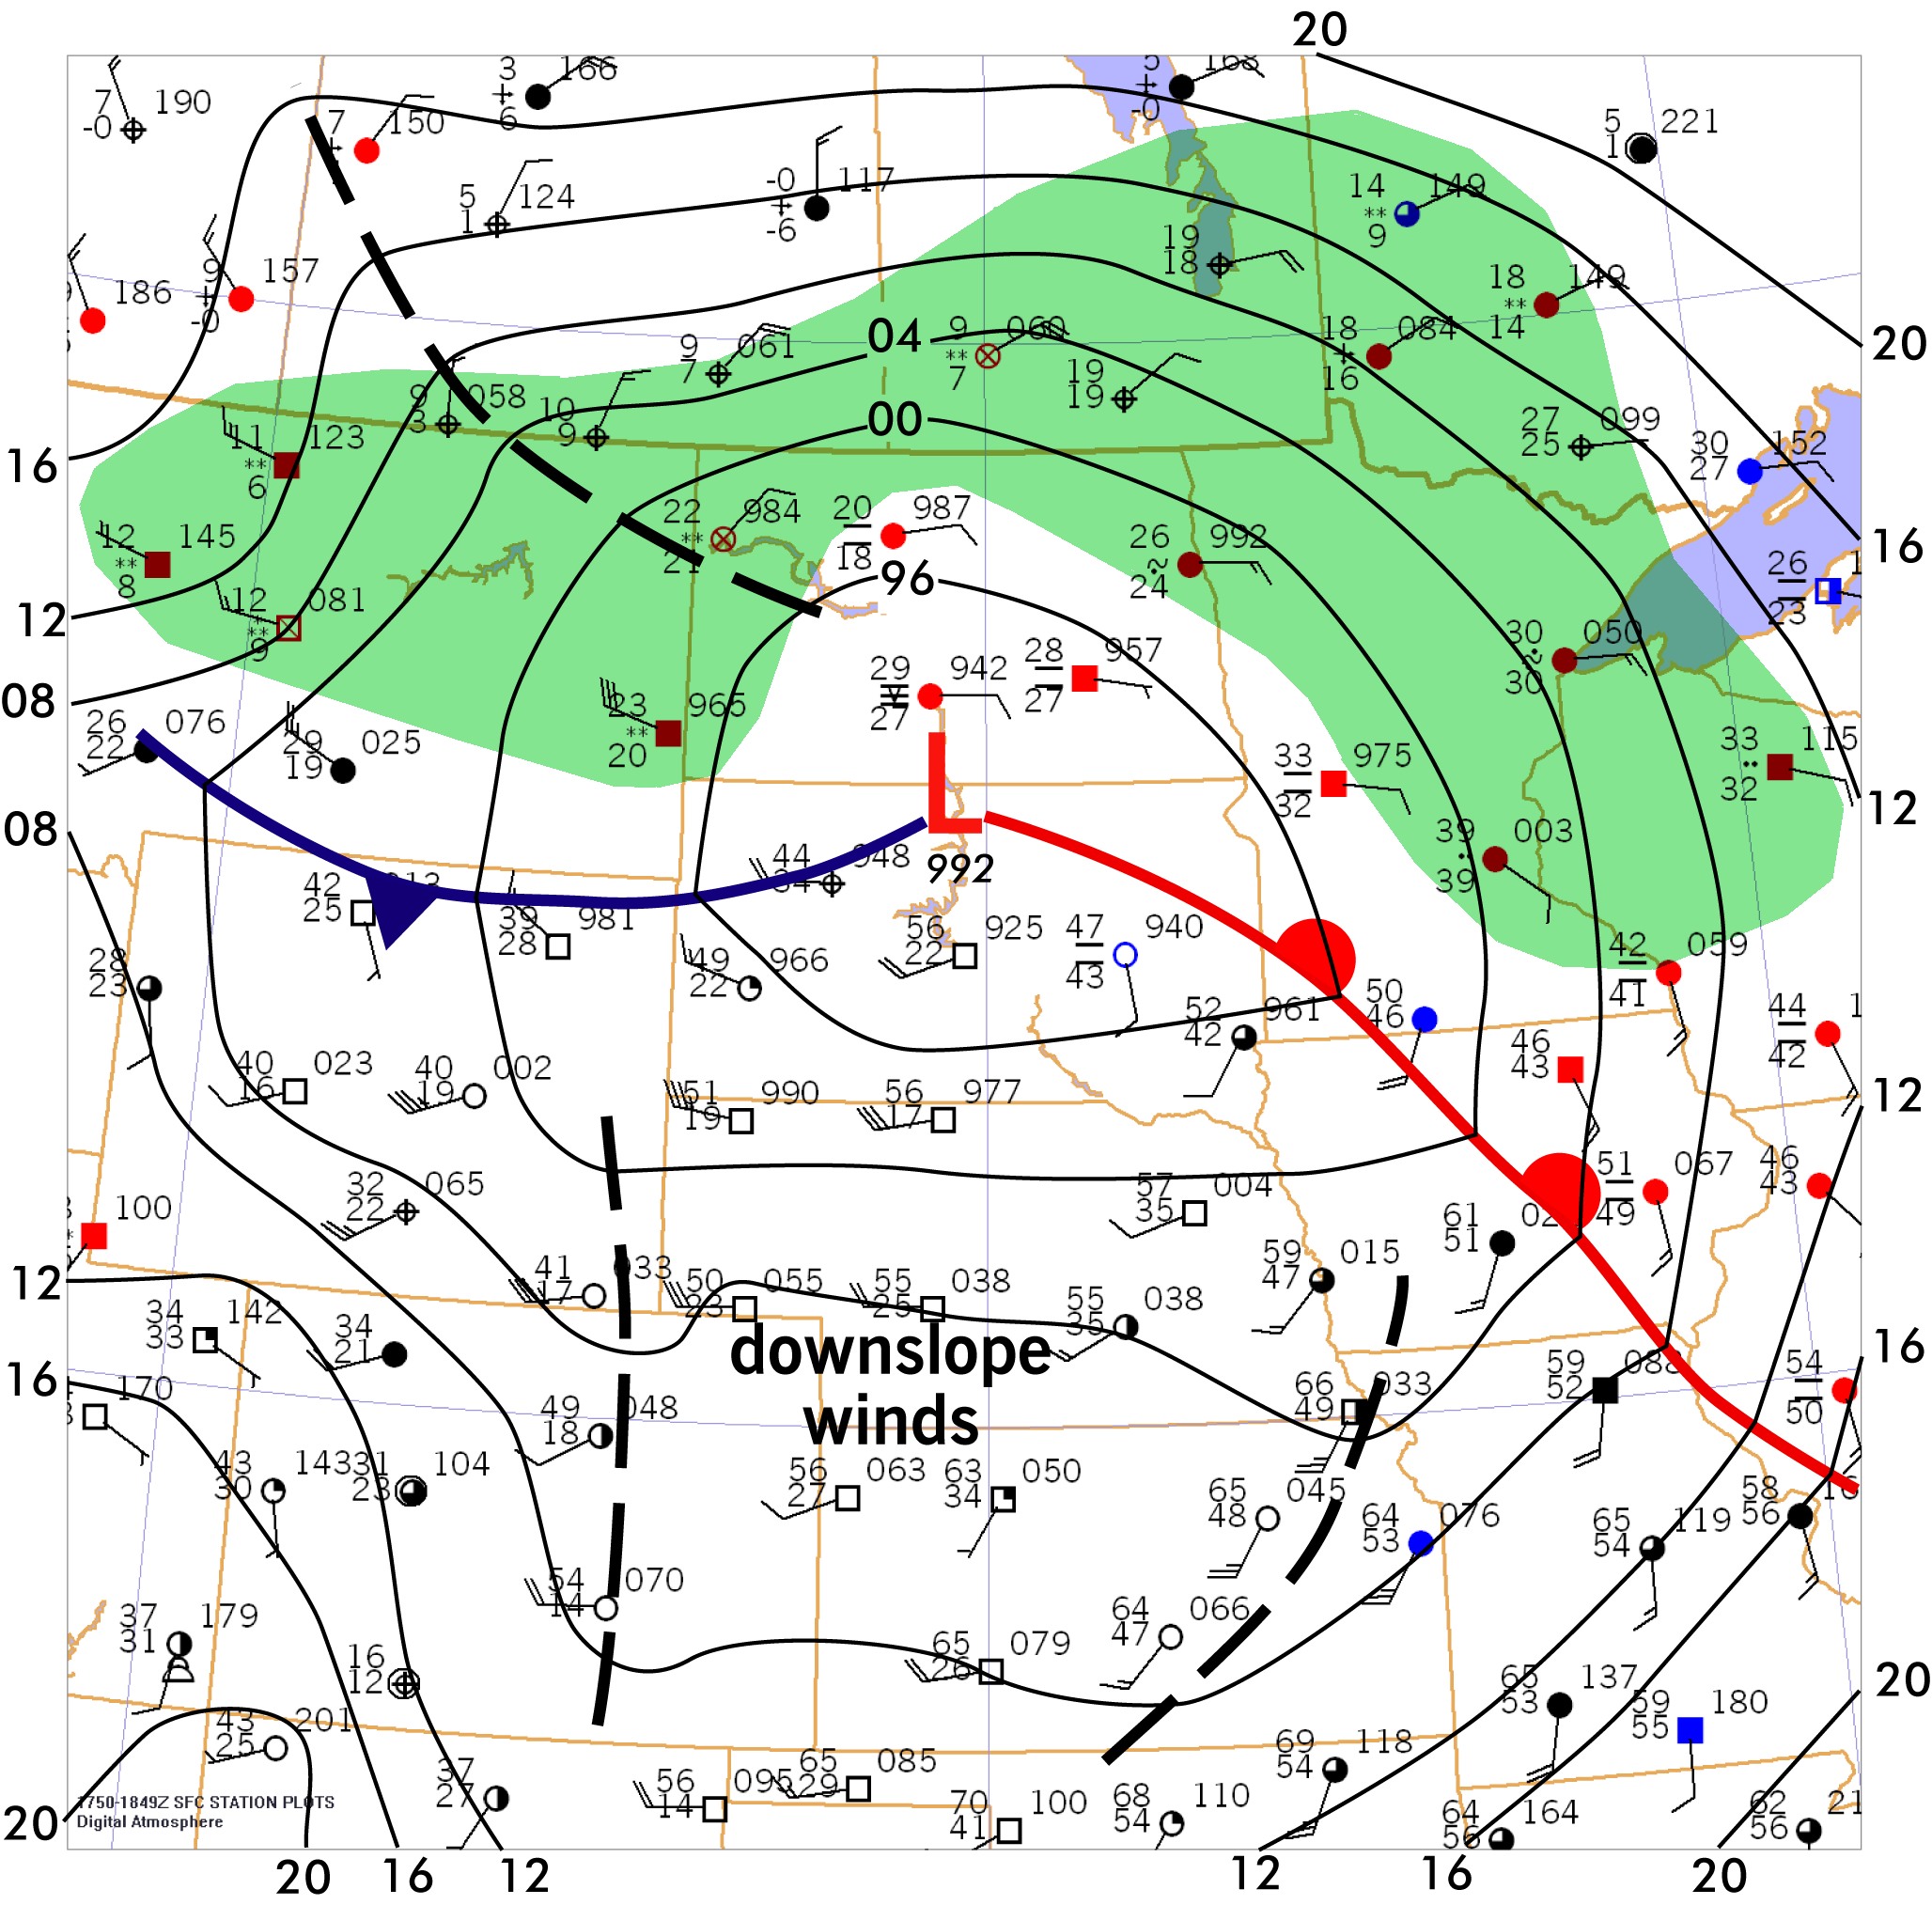
Draw isobars every four millibars (992, 996, 1000, 1004, etc.) using the plot model example at the lower right as a guide. As the plot model indicates, the actual millibar value for plotted pressure (xxx) is 10xx.x mb when the number shown is below 500, and 9xx.x when it is more than 500. For instance, 027 represents 1002.7 mb and 892 represents 989.2 mb. Therefore, when one station reports 074 and a nearby one shows 086, the 1008 mb isobar will be found halfway between the stations.

Click to enlarge

* * * * *
Scroll down for the solution
* * * * *
PART TWO: The Solution
The midday hours of December 30, 2004 brought a strong low-pressure area to the Great Plains, as shown in the puzzle solution. It had originated from the Pacific states, whose residents were already enduring a stormy winter. The system crossed through Nevada and Wyoming before reaching the Dakotas. Along with it was a large band of precipitation, highlighted by the green shading.
The surface map shows very strong temperature contrasts on either side of the low pressure area. Subzero temperatures covered much of Canada, while springlike warmth blanketed the central and southern plains. This contrast indicates that the system was baroclinic, capable of deepening rapidly and producing strong upward vertical motion. Rising motion can produce clouds and precipitation.
A baroclinic low tends to move eastward along the warm front and slightly toward the cold air, thus Minnesota and Wisconsin were directly in the path. The heaviest precipitation is usually found just to the left of the track. Nearly an inch of precipitation fell in northern North Dakota and Minnesota, much of it in the form of ice and snow. Major highways, including the Canadian freeway connecting Winnipeg to the United States, were shut down, and Fargo was paralyzed by freezing rain.
South of the low are downslope winds, which warm adiabatically. Adiabatic warming occurs merely due to a change in elevation and pressure, not necessarily from any external heat source, as the air mass descends from the Rocky Mountains into progressively lower elevations. Indeed, unseasonably warm temperatures were nosing into Kansas and parts of Nebraska, reaching nearly 70 degrees.
Three troughs were found: one in Colorado, associated with strong flow across the lee side of the Rocky Mountains, and the other in Kansas, associated with the axis of warmest temperatures. Another trough was located along the Montana-Saskatchewan border, which divided two polar air masses: a dry one from western Canada and a more humid one from the Hudson Bay region. Though surface convergence can cause rising motion along troughs, only the Saskatchewan trough was associated with poor weather as the relative humidity in both Colorado and Kansas, indicated by the temperature-dewpoint difference, was quite low.
Click to enlarge
©2005 Taylor & Francis
All rights reserved