Forecast Center
May/June 2005
by TIM VASQUEZ / www.weathergraphics.com
|
This article is a courtesy copy placed on the author's website for educational purposes as permitted by written agreement with Taylor & Francis. It may not be distributed or reproduced without express written permission of Taylor & Francis. More recent installments of this article may be found at the link which follows. Publisher's Notice: This is a preprint of an article submitted for consideration in Weatherwise © 2005 Copyright Taylor & Francis. Weatherwise magazine is available online at: http://www.informaworld.com/openurl?genre=article&issn=0043-1672&volume=58&issue=3&spage=56. |
PART ONE: The Puzzle
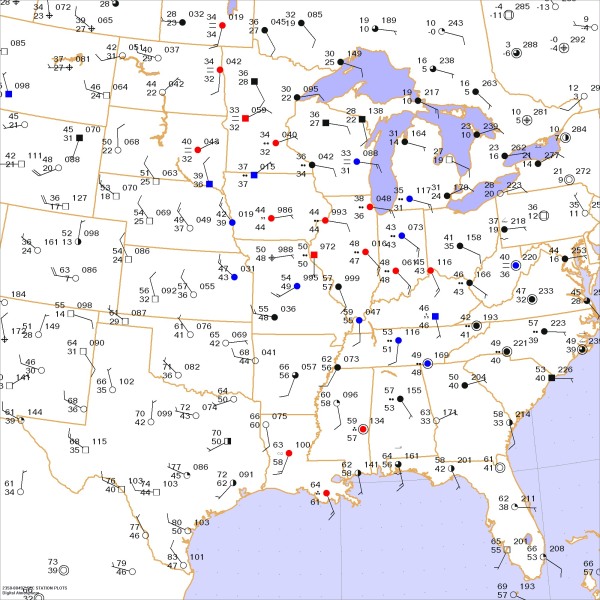
As the grip of winter loosens, intrusions of Canadian polar air diminish. Patterns begin moving west-to-east rather than north to south, and disturbances from the Pacific begin crossing the Rockies with clockwork regularity. These systems often combine with tropical moisture and present a forecast challenge, as this issue's puzzle shows.
Draw isobars every four millibars (992, 996, 1000, 1004, etc.) using the plot model example at the lower right as a guide. As the plot model indicates, the actual millibar value for plotted pressure (xxx) is 10xx.x mb when the number shown is below 500, and 9xx.x when it is more than 500. For instance, 027 represents 1002.7 mb and 892 represents 989.2 mb. Therefore, when one station reports 074 and a nearby one shows 086, the 1008 mb isobar will be found halfway between the stations.

Click to enlarge

* * * * *
Scroll down for the solution
* * * * *
PART TWO: The Solution
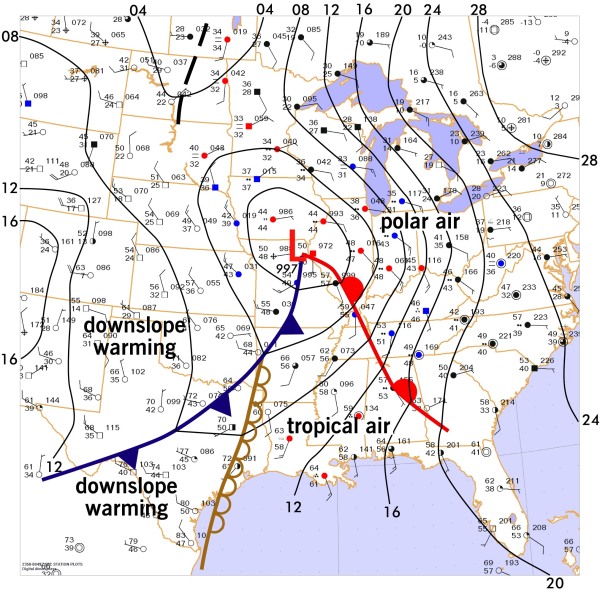
The evening of February 13, 2004 showed a deep frontal system centered on Missouri. The contrast between 60-degree temperatures in Mississippi and Alabama and 40s in the Ohio River Valley region delineated a sharp frontal boundary. Since wind across it blow from warm to cold air, it can be assumed that it's a warm front. Further west, a cold front in Texas and Oklahoma swept in a cool, fresh air mass from the northern Rockies.
The exact positioning of this cold front is perhaps one of the greatest challenges for this map, even for seasoned professionals. It is made more complicated by the presence of a dryline across east Texas (brown, bubbled line). A surprisingly common error made by forecasters is to place the cold front at this location, a zone which does indeed show great air mass contrasts. However in doing so, an erroneous assumption is made that the cold front passage ushers in hot air.
A more careful analysis shows that three air masses are actually present in Texas. In the extreme eastern state and in Louisiana is the mild, moist tropical air mass. In south and central Texas is a hot, dry air mass that originates from the Mexican plateau region. A dryline separates these two air masses. Finally in northwest Texas is the cool air mass, heated slightly as it descends from the Rockies. It is this air mass that is associated with the cold front.
Pacific systems are associated with showers, thunderstorms, and sometimes tornado outbreaks. The severity of the storms is loosely associated with the dewpoint temperature, which not only indicates the quantity of moisture in the air but is related to instability. The greater the reading, the higher the risk of severe weather. On this particular day, dewpoints in the tropical sector were in the mid-50s, suggesting a marginal threat of severe weather. Where the cold front and the dryline impinge on this moist air, the risk is greatest for thunderstorms, and indeed a line of storms covered much of southwest Louisiana.

Click to enlarge
©2005 Taylor & Francis
All rights reserved