Forecast Center
September/October 2005
by TIM VASQUEZ / www.weathergraphics.com
|
This article is a courtesy copy placed on the author's website for educational purposes as permitted by written agreement with Taylor & Francis. It may not be distributed or reproduced without express written permission of Taylor & Francis. More recent installments of this article may be found at the link which follows. Publisher's Notice: This is a preprint of an article submitted for consideration in Weatherwise © 2005 Copyright Taylor & Francis. Weatherwise magazine is available online at: http://www.informaworld.com/openurl?genre=article&issn=0043-1672&volume=58&issue=5&spage=82. |
PART ONE: The Puzzle
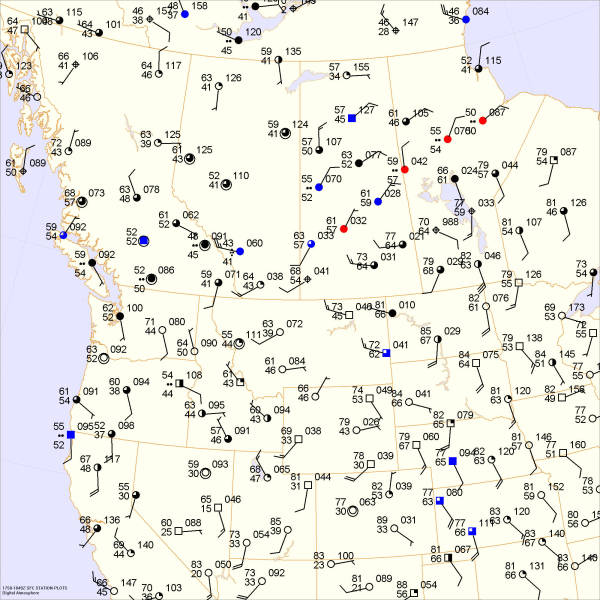
During the summertime, weather patterns shift poleward. The Bermuda high and southwest heat low begin dominating the United States, while Canada progresses from being a source of polar air to hosting a venue for the complete lifecycle of weather systems. July, August, and September are fascinating and challenging months for Canadian weather forecasters, and in this puzzle we'll take a look at what makes these systems so unique.
Draw isobars every four millibars (1004, 1006, 1008, etc.) using the plot model example at the lower right as a guide. As the plot model indicates, the actual millibar value for plotted pressure (xxx) is 10xx.x mb when the number shown is below 500, and 9xx.x when it is more than 500. For instance, 027 represents 1002.7 mb and 892 represents 989.2 mb. Therefore, when one station reports 074 and a nearby one shows 086, the 1008 mb isobar will be found halfway between the stations.

Click to enlarge

* * * * *
Scroll down for the solution
* * * * *
PART TWO: The Solution
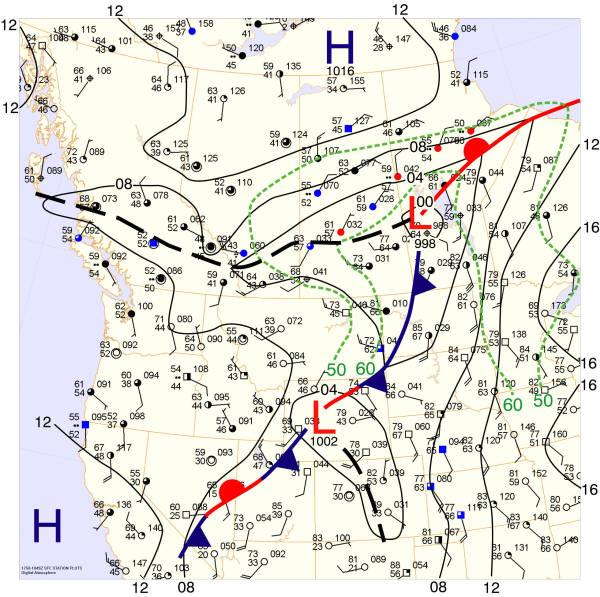
A powerful weather system was moving through Canada and the northern United States during the afternoon of June 18, 2005. Warm tropical air surged far north into Canada, with 80-degree temperatures reaching Hudson Bay, and a polar front extended through the central Canadian provinces with a 998-millibar surface low over Manitoba.
With the warm temperatures came high dewpoint temperatures that surged northward, feeding the developing system. The dewpoint temperatures represented rich moisture, originating from evapotranspiration, evaporation, and most importantly, warm water bodies such as the Atlantic Ocean and Gulf of Mexico. These dewpoint contours, or isodrosotherms, have been outlined in green in the puzzle solution. The rich moisture allowed the atmosphere to become very unstable across the Canadian prairies, producing severe storms in Saskatchewan that flooded the town of Melville the previous evening.
The band of high dewpoints trailing along the trough westward into Alberta, combined with strong convergence along the trough, was responsible for thunderstorms that pushed local rivers and reservoirs to the brink. The province had already received two to four times the normal rainfall for June. By nightfall, up to four additional inches of rain would fall, unleashing severe flooding in the Calgary and Red Deer area. Thousands of people would be evacuated from their homes by nightfall, with damage estimated at close to $400 million (U.S. $330 million).
The station plots across the Great Plains shows the "conveyor belt" of moisture, with mid-60s dewpoints from Texas to Nebraska and the Dakotas. Where this conveyor belt impinges on frontal systems, such as in western South Dakota, there is the threat for showers and thunderstorms. The front creates a source of lift, while the moisture provides instability and fuel for developing precipitation. The upper-level temperatures and winds dictate whether or not the instability can be released, and influences the type of showers and storms that might occur and the extent of the coverage.
In Montana, the cool weather behind the front was tempered by downslope warming, as the cold air mass descended, compressed, and warmed. This allowed temperatures to reach the 70s. Further west into the Great Basin region, temperatures were unseasonably cool, with readings struggling into the 60s. Ely, Nevada had started the morning at 36 degrees, while Pocatello, Idaho started at 37.

Click to enlarge
©2005 Taylor & Francis
All rights reserved