Forecast Center
January/February 2006
by TIM VASQUEZ / www.weathergraphics.com
|
This article is a courtesy copy placed on the author's website for educational purposes as permitted by written agreement with Taylor & Francis. It may not be distributed or reproduced without express written permission of Taylor & Francis. More recent installments of this article may be found at the link which follows. Publisher's Notice: This is a preprint of an article submitted for consideration in Weatherwise © 2006 Copyright Taylor & Francis. Weatherwise magazine is available online at: http://www.informaworld.com/openurl?genre=article&issn=0043-1672&volume=59&issue=1&spage=82. |
PART ONE: The Puzzle
Before the advent of numerical forecasting, American meteorologists had a long and enduring preoccupation with storm tracks. Knowledge of where a storm was brewing on the West Coast often gave indications of what would unfold on the East Coast a few days later. The most common development area was Colorado and New Mexico, a location that sent storm systems northeast into the Ohio River Valley and the Appalachians. But sometimes the storms began their journey in the Pacific Northwest, as we shall see in this example.
Draw isobars every eight millibars (1008, 1000, 992, etc.) using the plot model example at the lower right as a guide. As the plot model indicates, the actual millibar value for plotted pressure (xxx) is 10xx.x mb when the number shown is below 500, and 9xx.x when it is more than 500. For instance, 027 represents 1002.7 mb and 892 represents 989.2 mb. Therefore, when one station reports 074 and a nearby one shows 086, the 1008 mb isobar will be found halfway between the stations.

Click to enlarge

* * * * *
Scroll down for the solution
* * * * *
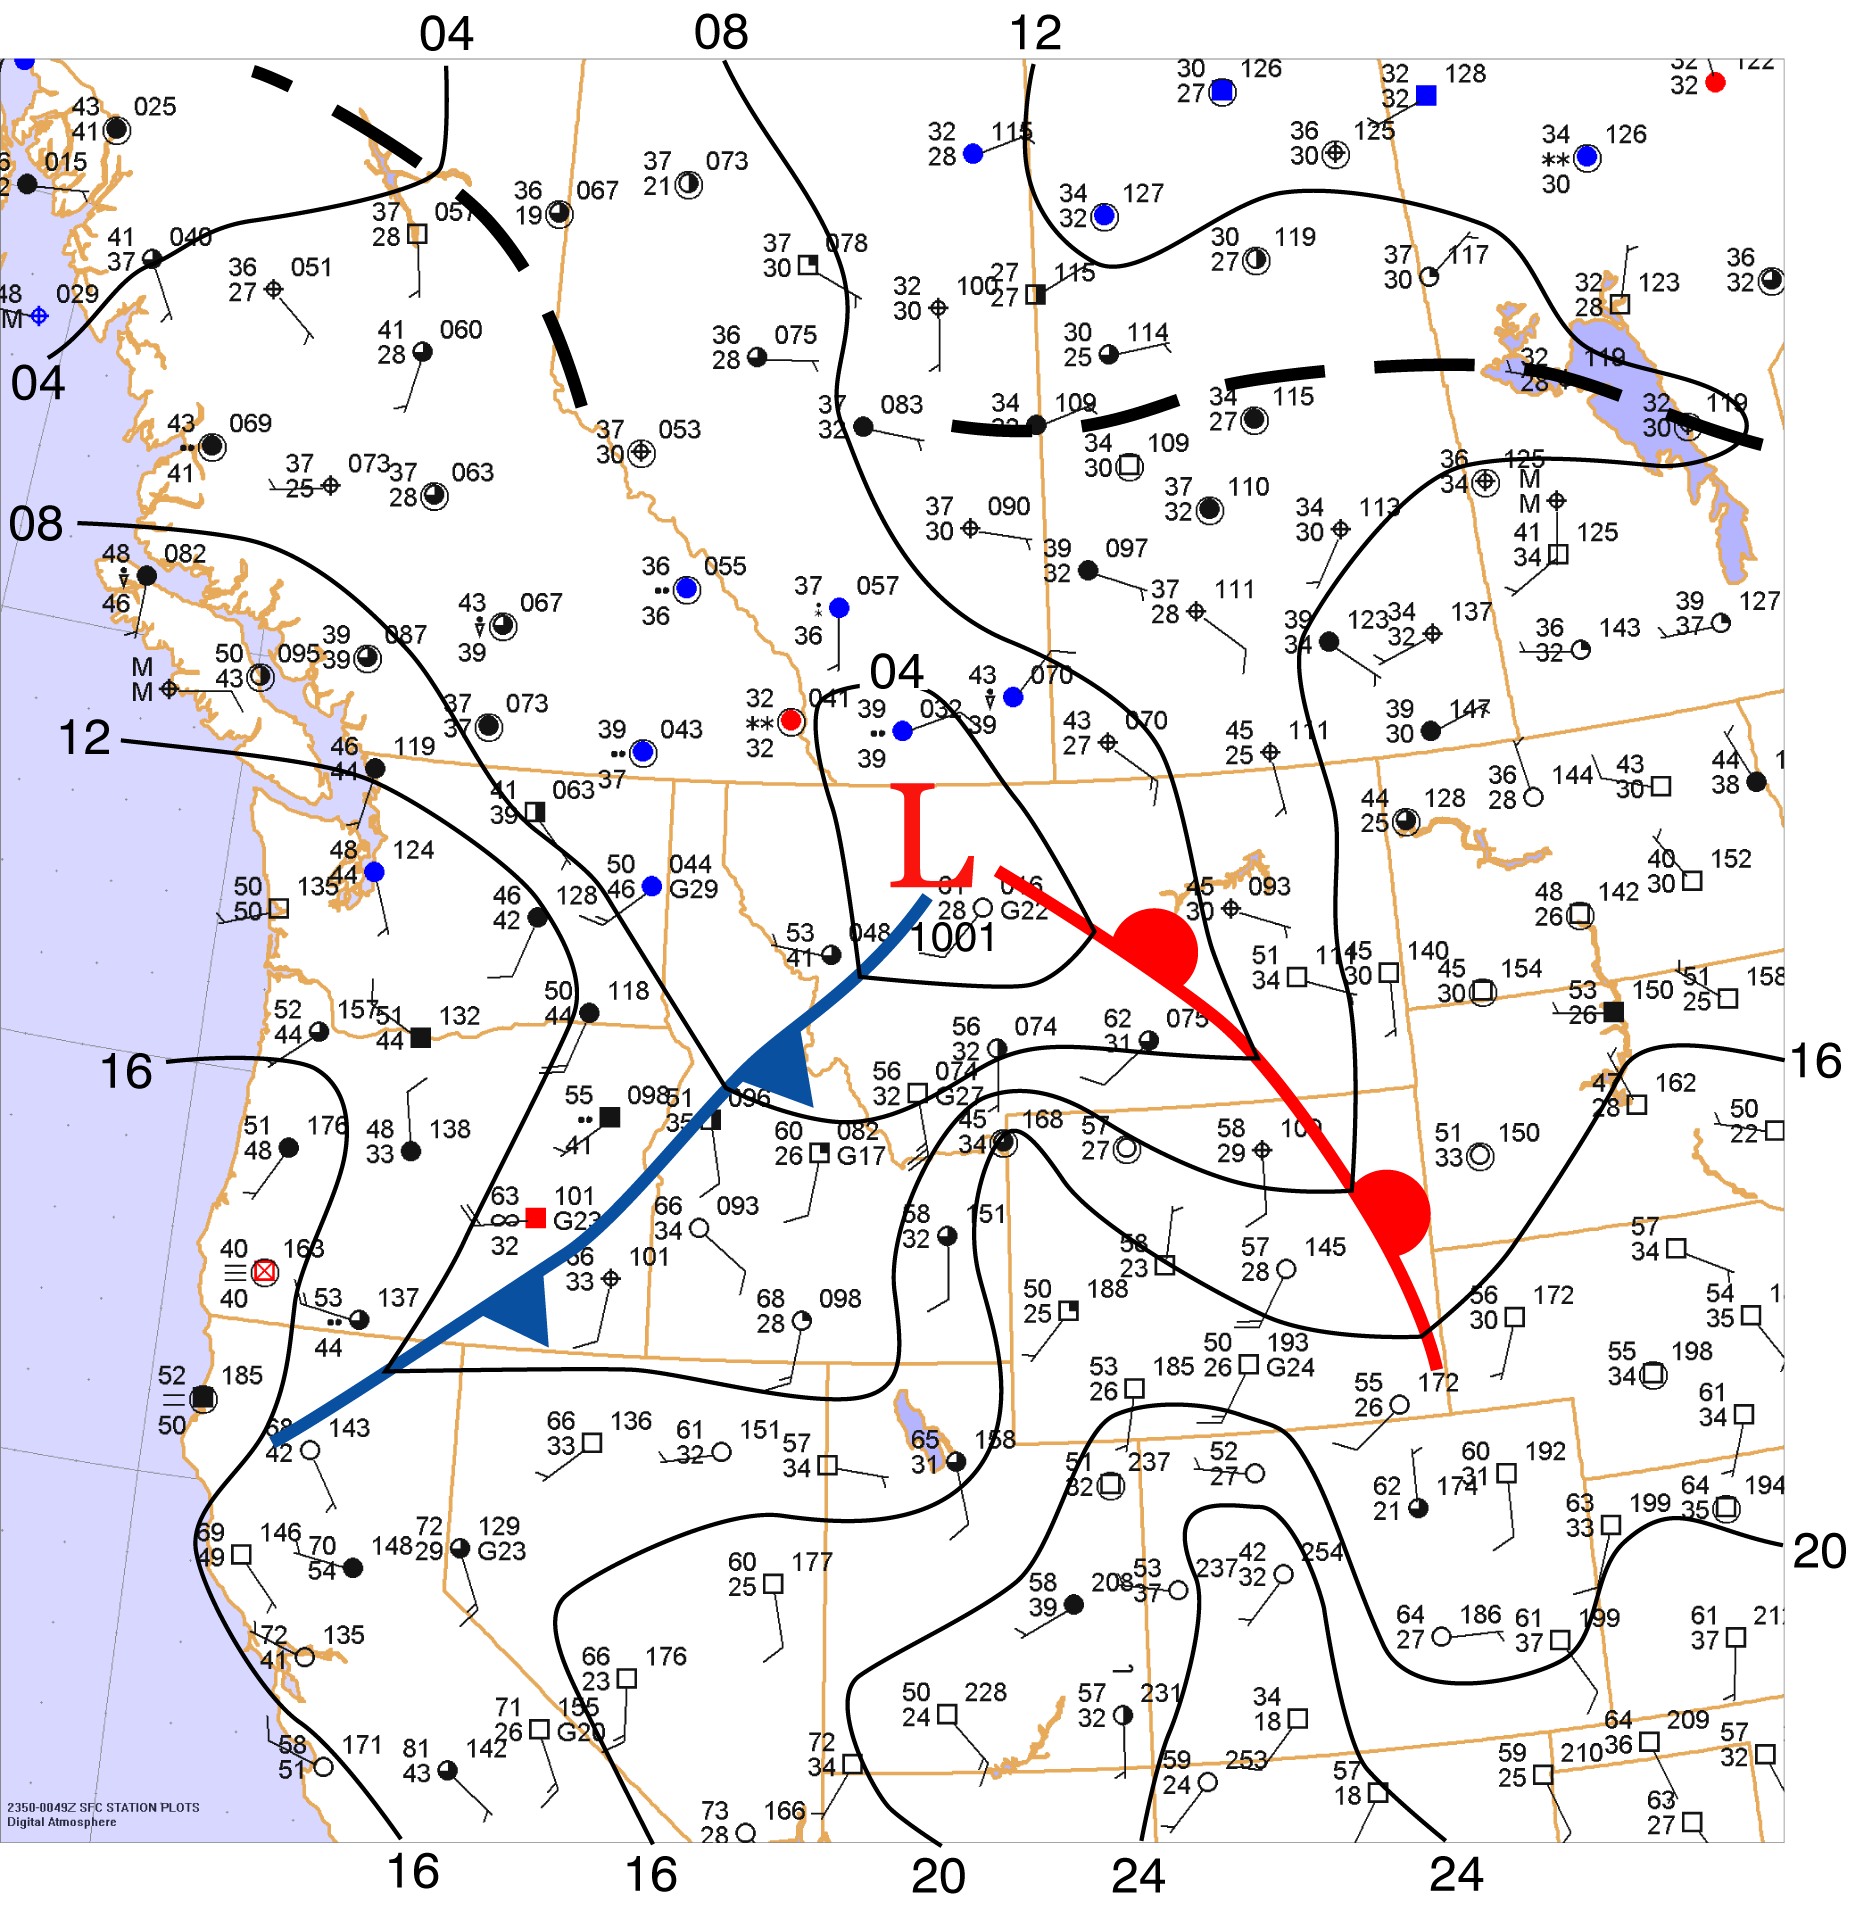
PART TWO: The Solution
The evening of November 1, 2005. showed a distinct area of low pressure in Montana, associated with a cold front and warm front. Unfortunately, fronts originating from the Pacific Ocean can be quite difficult to find while they cross the rough terrain of the western United States. Weather maps don't present the entire picture -- sometimes it's necessary to monitor trends of wind, temperature, and pressure at various stations to keep tabs on the front's progress.
In this example, a cold front is rather well-defined in the Idaho and Oregon region. Warm, fair weather and southerly winds in southern Idaho contrast sharply with cloudy, cool conditions and west winds in most of Oregon. This defines the position of the front. Using this as a first guess, it becomes easier to find the remainder of the front near the Montana low and the California-Oregon border region. The front has characteristics of an anafront, a type that is quite common in the Pacific Northwest compared to elsewhere in the U.S. Precipitation and clouds are found mainly behind the front rather than along or ahead of it. Passage of the front ushers in a period of cloudy, rainy weather, rather than brisk, clearing conditions.
Warm fronts are always a little difficult to find. However, in this example the wind field begs for attention. Note the strong, gusty southwest winds in Wyoming, which contrasts with the cool, stagnant, and calm weather across the Dakotas. Part of the reason for this is that the Rocky Mountain region is higher in elevation, and especially in a warm, unstable air mass can pick up momentum from the energetic upper-level winds. But the real key is in the isobar fields: they are packed close together in Wyoming compared to the Dakotas, and closely-packed isobars are associated with a stronger pressure gradient, and thus a stronger wind.
A weather system such as this one tends to bring a storm track that affects the Great Lakes region. As the system cycles through occlusion and baroclinic development, it can send deep occluded lows toward the Hudson Bay region, bringing snow and bad weather to southern and central Canada.
Readers may be interested to know that they are never matching wits against a computer. Computer-generated isobars, which are very common on the Internet, have a tendency to "smooth out" important kinks and twists, and they never quite match the station plot values. All Forecast Center puzzle solutions are hand-drawn by the author using the software program Adobe Illustrator*. When drawn by a practiced meteorologist or hobbyist, hand-drawn isobars tend to be more exact and bring out a wealth of important patterns that catch the forecaster's attention. Some of the best National Weather Service offices take great pride in their hand-drawn analyses and post them prominently!
Click to enlarge
©2006 Taylor & Francis
All rights reserved