Forecast Center
March/April 2006
by TIM VASQUEZ / www.weathergraphics.com
|
This article is a courtesy copy placed on the author's website for educational purposes as permitted by written agreement with Taylor & Francis. It may not be distributed or reproduced without express written permission of Taylor & Francis. More recent installments of this article may be found at the link which follows. Publisher's Notice: This is a preprint of an article submitted for consideration in Weatherwise © 2006 Copyright Taylor & Francis. Weatherwise magazine is available online at: http://www.informaworld.com/openurl?genre=article&issn=0043-1672&volume=59&issue=2&spage=82. |
PART ONE: The Puzzle
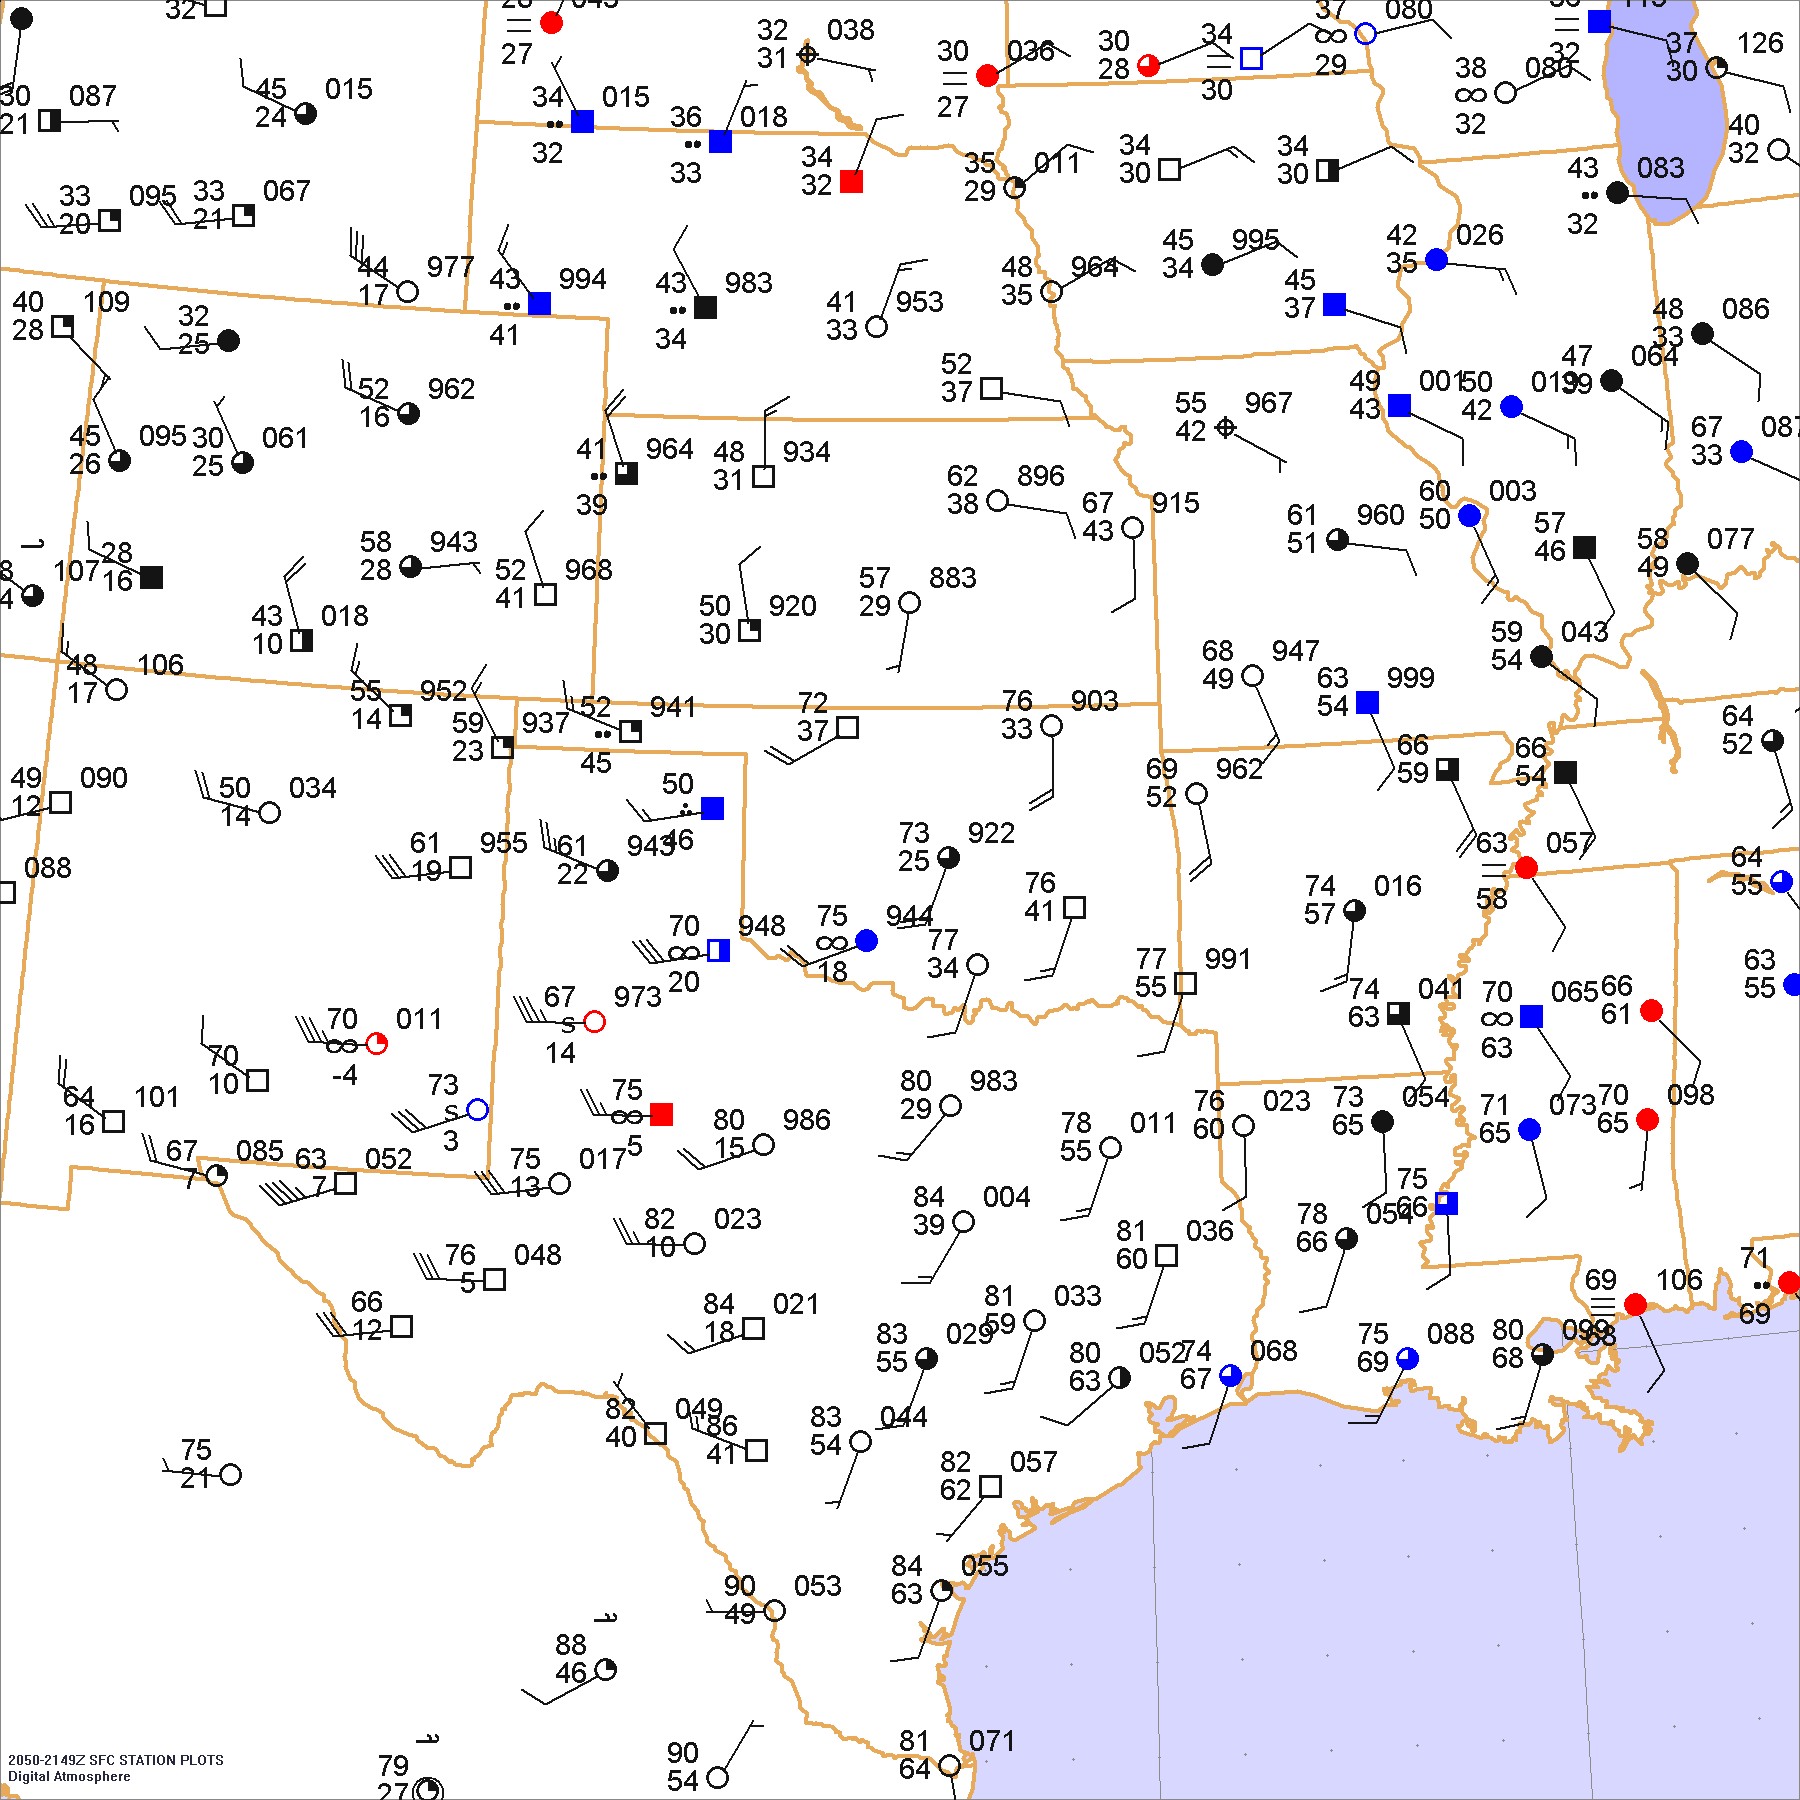
During the winter and spring months, the frequent incursions of polar air masses into the United States are often punctuated by deep low pressure systems. These lows are what bring duststorms, tornadoes, and hot weather to parts of the country not only during the springtime but during the dead of winter. In this example we'll take a look at such an example.
Draw isobars every eight millibars (1008, 1000, 992, etc.) using the plot model example at the lower right as a guide. As the plot model indicates, the actual millibar value for plotted pressure (xxx) is 10xx.x mb when the number shown is below 500, and 9xx.x when it is more than 500. For instance, 027 represents 1002.7 mb and 892 represents 989.2 mb. Therefore, when one station reports 074 and a nearby one shows 086, the 1008 mb isobar will be found halfway between the stations.
Click to enlarge

* * * * *
Scroll down for the solution
* * * * *
PART TWO: The Solution
The evening of January 1, 2006 showed a classic example of an extratropical cyclone emerging from the Rocky Mountains. Not only did it keep weather forecasters busy, but it proved to be a headache for firefighters in drought-stricken west Texas who were battling wind-driven range fires (note the haze symbols in west Texas).
Perhaps the most intriguing feature on the solution is the brown, squiggly frontlike symbol that stretches from eastern Oklahoma to south Texas. This is the dryline. When southerly winds set up over the southern plains, air is brought northward from both the Gulf of Mexico and from the Mexican interior. This air can have markedly different moisture characteristics. When cyclonic flow is present, such as when a disturbance emerges from the Rockies, the convergent flow increases the air mass contrasts by bringing them into tighter proximity. On this map, we see 20s dewpoints in the Dallas area with 60s dewpoints in east Texas. A dryline demarcates the two air masses. To forecasters, it represents the westward limit of rich Gulf moisture, and since these westward areas are in proximity to approaching upper-level disturbances, drylines are often a hot zone for thunderstorm activity, especially during the spring months.
The area of westerly winds behind the cold front shows very weak cooling. This is because the region is in an area of downslope flow, where air is descending from the higher elevations of the Rocky Mountains to nearly sea level. The air compresses and warms. Even for seasoned forecasters, it can be extremely challenging to find fronts in a downslope area. In the Texas Panhandle into central New Mexico, a trough may be found. This separates polar air originating from Pacific regions from that originating from Canada. It is represented by some forecasters as a secondary cold front, and certainly may bring its own sharp temperature contrasts.
East of the low is a warm front, which is positioned at the nose of warm air originating from the Gulf of Mexico. This nose is also at the leading edge of the richest moisture field, and the moisture and convergence along the warm front often combine to produce severe weather. At the time of this map, hail was being reported in Alabama. By the next day tornadoes would touch down in Kentucky as the weather system approached the Ohio River valley region and the warm front advanced northward.

Click to enlarge
©2006 Taylor & Francis
All rights reserved