Forecast Center
May/June 2007
by TIM VASQUEZ / www.weathergraphics.com
|
This article is a courtesy copy placed on the author's website for educational purposes as permitted by written agreement with Taylor & Francis. It may not be distributed or reproduced without express written permission of Taylor & Francis. More recent installments of this article may be found at the link which follows. Publisher's Notice: This is a preprint of an article submitted for consideration in Weatherwise © 2007 Copyright Taylor & Francis. Weatherwise magazine is available online at: http://www.informaworld.com/openurl?genre=article&issn=0043-1672&volume=60&issue=3&spage=66. |
PART ONE: The Puzzle
Sharp temperature contrasts are found across North America throughout the spring months as polar air mass production continues and solar heating intensifies across the southern United States. These strengthening contrasts bring an increase in severe weather, winter storms, and deep weather systems. As a result, a meteorologist who forecasts these weather events has to be proficient at the art of frontal analysis. Though numerical forecasting can handle the raw temperature and humidity fields and produce reasonably accurate forecasts, only a human can sort through the patterns and analyze the front itself. In this way, diagnosing the location and movement of a weather system and keeping tabs on it gives forecasters an important edge on the models.
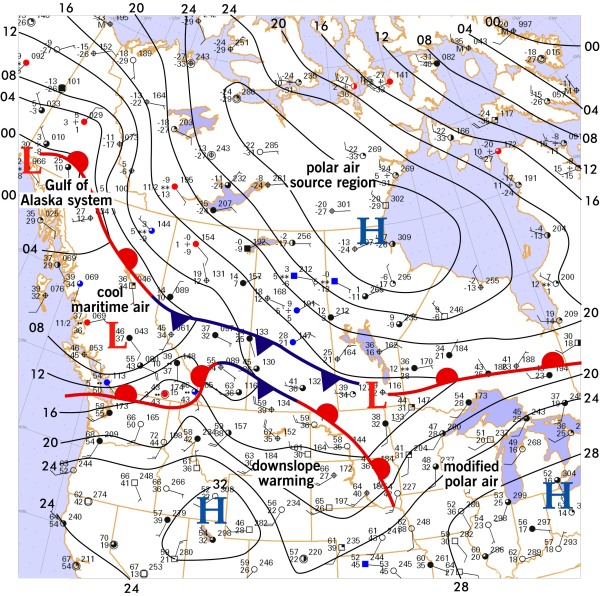
This weather map is for the afternoon hours in March. Draw isobars every eight millibars (1008, 1000, 992, etc.) using the plot model example at the lower right as a guide. As the plot model indicates, the actual millibar value for plotted pressure (xxx) is 10xx.x mb when the number shown is below 500, and 9xx.x when it is more than 500. For instance, 027 represents 1002.7 mb and 892 represents 989.2 mb. Therefore, when one station reports 074 and a nearby one shows 086, the 1008 mb isobar will be found halfway between the stations. Then try to find the locations of fronts, highs, and lows.

Click to enlarge

* * * * *
Scroll down for the solution
* * * * *
PART TWO: The Solution
The afternoon of March 11, 2007, pictured in the map series shown, brought a large polar air mass covering much of northern Canada and a series of fronts along the U.S.-Canadian border. The puzzle is made more challenging by the fact that there isn't a "classic" area of low pressure, yet significant temperature contrasts appear across the map. This makes it an ultimate test for finding fronts.
When analyzing the map, always start with the big picture. Frigid temperatures well below zero in the Hudson Bay region contrast sharply with 60s and 70s across the western United States. Naturally we will find the fronts in between these two regions. However, even with this knowledge, many amateur analysts might look at the assortment of temperature gradients, wind directions, and weather, and become somewhat confused where to draw the fronts. It must be remembered that the prime definition of a front is a boundary located on the warm side of a strong temperature gradient. Wind shifts are helpful indicators but are not as important as the temperature change itself.
Surprisingly, one effective technique is to envision an imaginary car trip crossing through the air mass regimes. Starting in South Dakota, for example, we would see southwesterly winds and very warm temperatures. Crossing into Minnesota, the temperatures suddenly drop about 20 degrees, but the winds remain southwesterly. This sudden temperature drop marks the location of a front. Yet when we reach western Ontario, we find an even more severe temperature drop with winds becoming northerly. This marks yet another front. Both of these front locations can be sketched in with pencil and revised as more locations are found.
Is a front warm or cold? Continuity between two or more charts yields the answer, however as a starting point we can consider the mean wind component across the frontal boundary. If winds are primary blowing from warm to cool air, then we can assume warm air is replacing cool air and a warm front exists. Winds blowing from cool to warm air might indicate a cold front. And if the wind component is ambiguous, then an assumption is made that it's a stationary front. This technique was used for the puzzle solution.
In this example, a "dual front" configuration extends throughout much of the map. The two fronts divide three air masses: a warm air mass in the United States which has stagnated, a cool air mass north of the U.S.-Canada border, and a frigid polar air mass. The fronts serve as potent zones for the development of what are called baroclinic cyclones, which feed off of both the temperature gradient and upper tropospheric energy. No significant development has taken place on this map, though the vague low pressure area in British Columbia went on to produce a powerful surface system that tracked eastward through the Prairie provinces and produced heavy snow in northern parts of Saskatchewan and Alberta and high wind warnings along the international border.

Click to enlarge
©2007 Taylor & Francis
All rights reserved