Forecast Center
January/February 2008
by TIM VASQUEZ / www.weathergraphics.com
|
This article is a courtesy copy placed on the author's website for educational purposes as permitted by written agreement with Taylor & Francis. It may not be distributed or reproduced without express written permission of Taylor & Francis. More recent installments of this article may be found at the link which follows. Publisher's Notice: This is a preprint of an article submitted for consideration in Weatherwise © 2008 Copyright Taylor & Francis. Weatherwise magazine is available online at: http://www.informaworld.com/openurl?genre=article&issn=0043-1672&volume=61&issue=1&spage=82. |
PART ONE: The Puzzle
The Forecast Center zooms in on the northern Plains and Midwest states for this issue, taking a look at a November weather system heading for the Great Lakes region. An occluded front, a warm front, and a cold front will be found. Bear in mind the cardinal rule of frontal placement: always draw it on the warm side of a temperature transition zone. A change in temperature is the primary indicator of a front. Wind shifts and pressure troughs are also important indicators, but without a temperature transition they do not represent a front.
We'll take a special look at cloud cover in this puzzle. Some of the station plots feature a number just to the right of the circle or square, prefixed with "C", which indicates the observed ceiling in hundreds of feet above ground level. By definition a ceiling is the height of the lowest layer of cloud that covers more than half of the sky. Using the standard World Meteorological Organization classification, low clouds such as cumulus, stratus, and stratocumulus are found at 0 through 6500 feet, middle clouds such as altostratus and altocumulus are found at 6500 through 20,000 feet, and high clouds such as cirrus and cirrostratus are found at 20,000 feet and above. So by looking at the ceiling, forecasters can get an idea of what kind of cloud layers are found across a region and how it compares to the cloud regimes in typical weather systems.
This weather map is an event during the evening hours in November. Draw isobars every four millibars (1008, 1004, 1000, 996, etc.) using the plot model example at the lower right as a guide. As the plot model indicates, the actual millibar value for plotted pressure (xxx) is 10xx.x mb when the number shown is below 500, and 9xx.x when it is more than 500. For instance, 027 represents 1002.7 mb and 892 represents 989.2 mb. Therefore, when one station reports 074 and a nearby one shows 086, the 1008 mb isobar will be found halfway between the stations. Then try to find the locations of fronts, highs, and lows.

Click to enlarge

* * * * *
Scroll down for the solution
* * * * *
PART TWO: The Solution
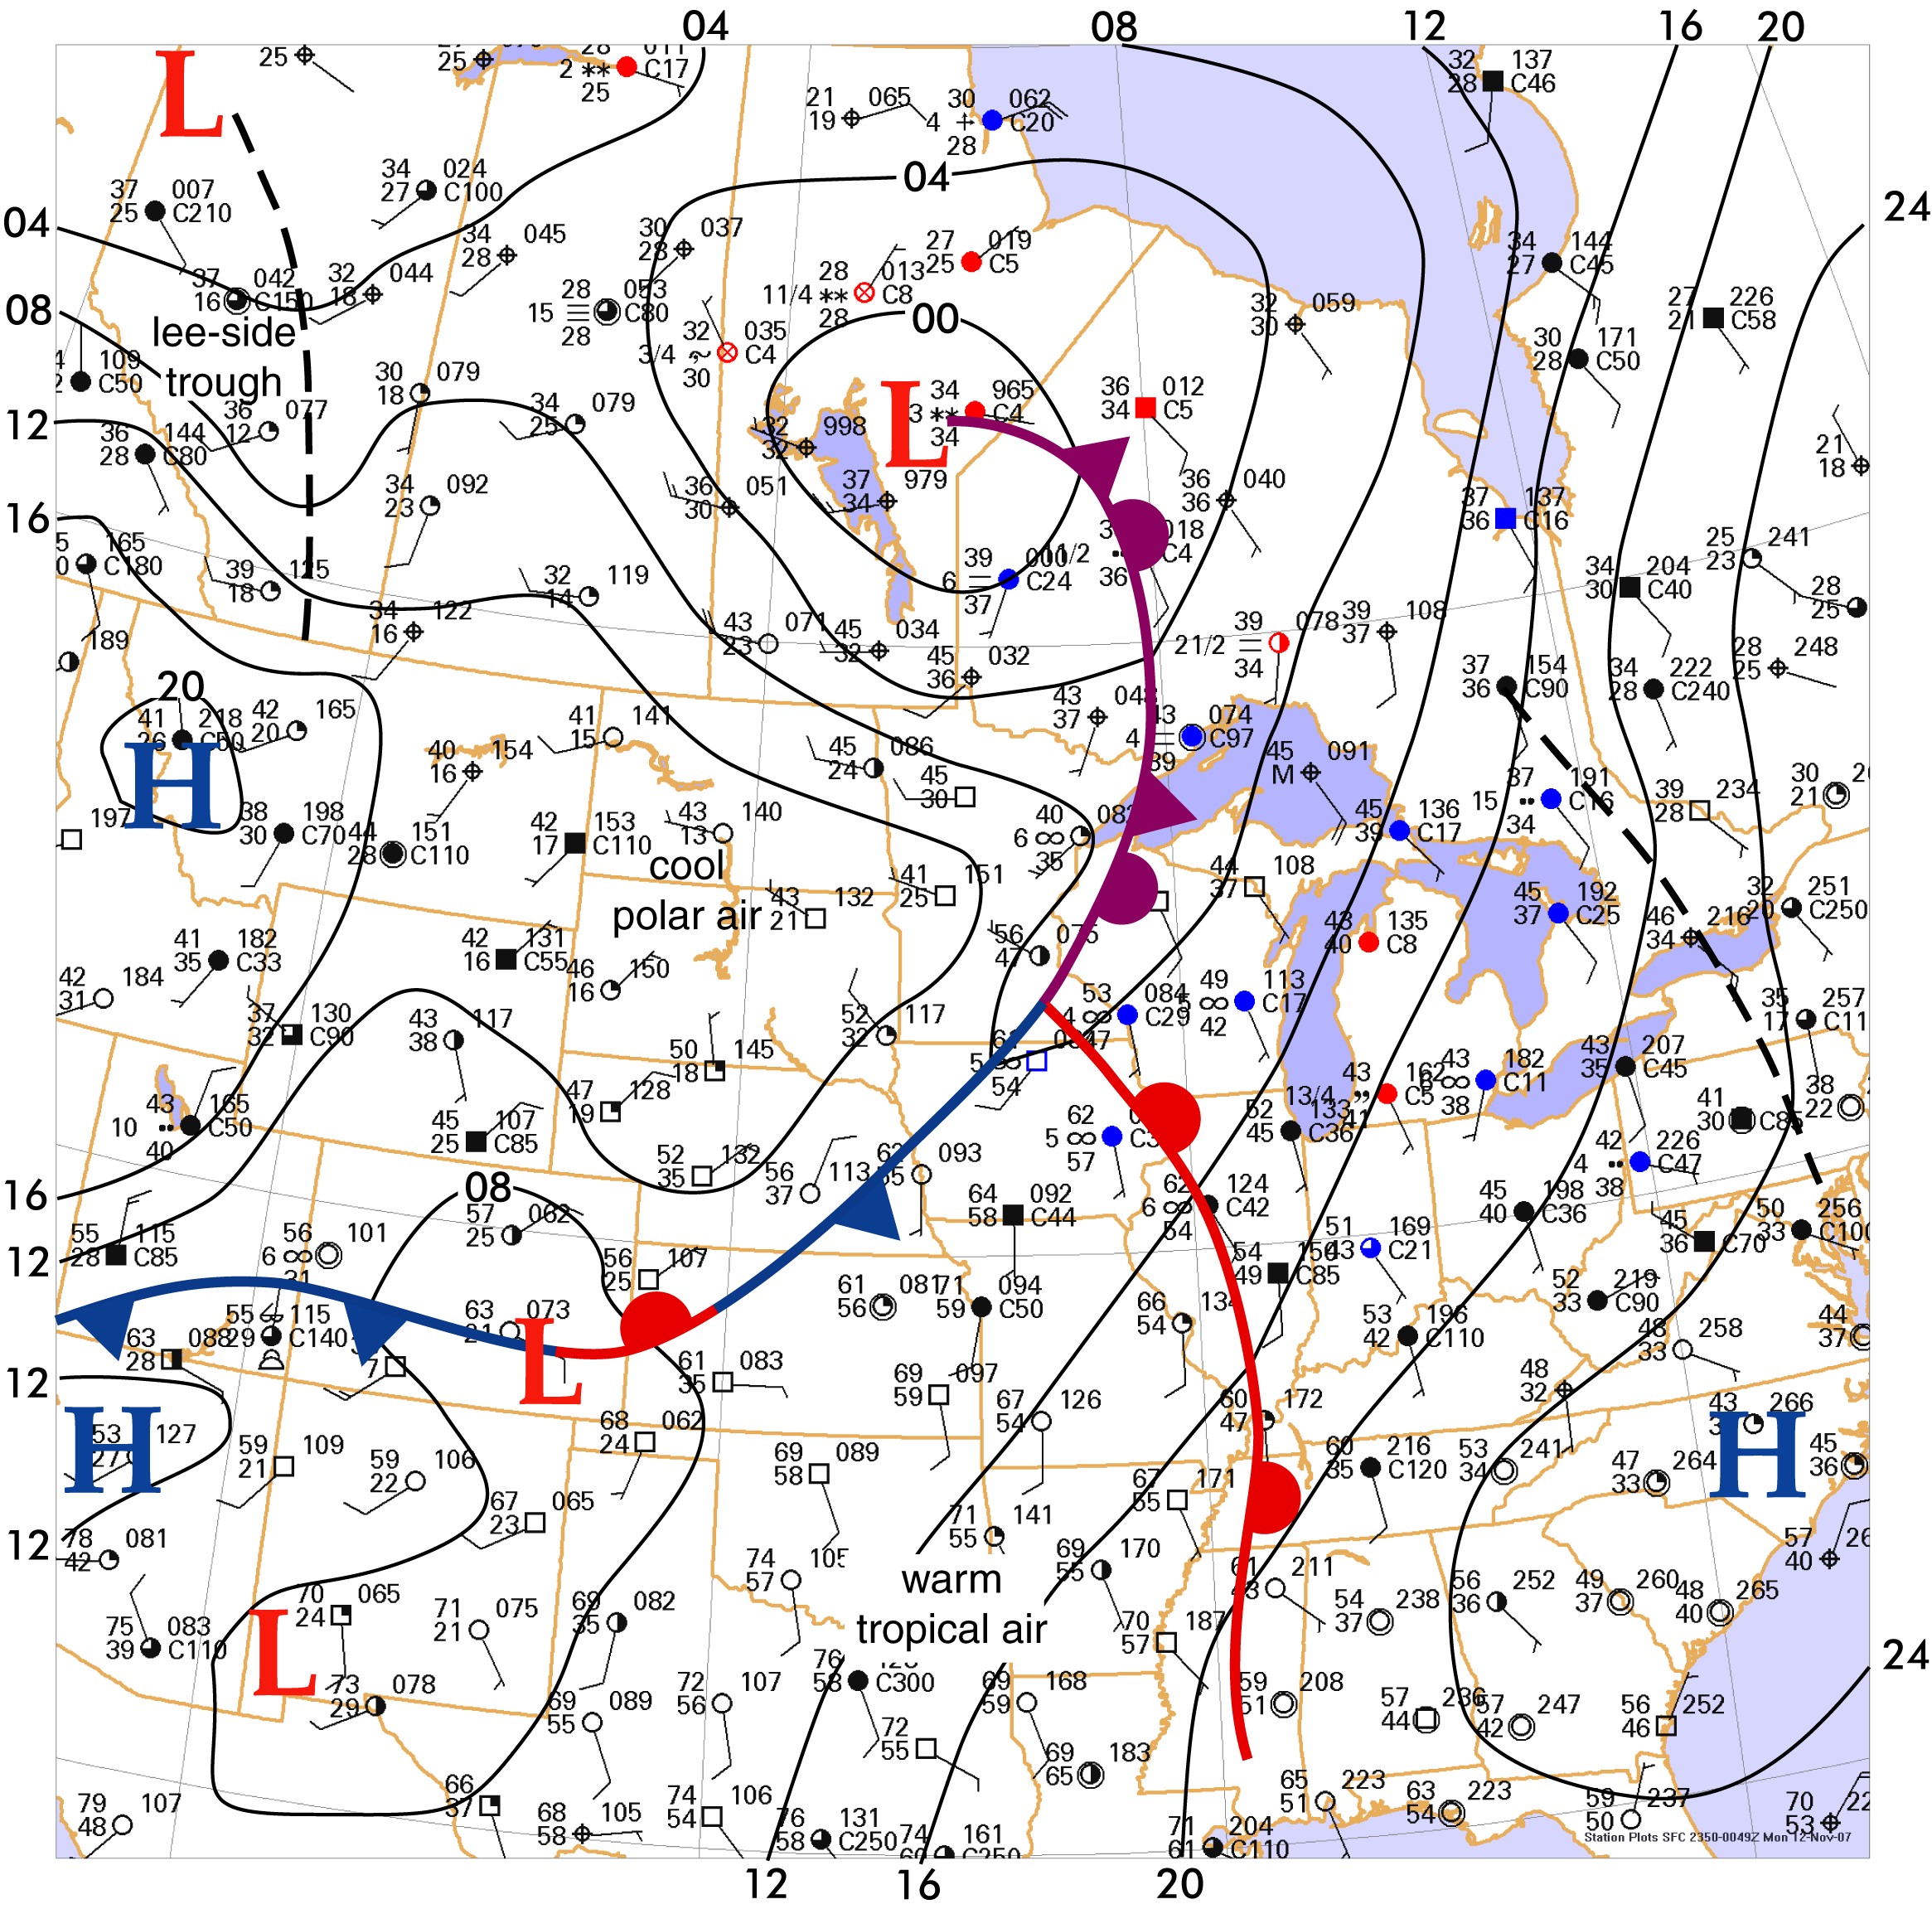
The afternoon of November 11, 2007 showed a mature extratropical cyclone departing the Canadian Prairie provinces and entering the Great Lakes region. The cold front, stretching from Minnesota to Colorado, is by far the easiest feature to find, showing a strong temperature contrast and a sharp change in wind direction. In Nebraska, for example, the cold front brings a temperature fall from the low 60s to the low 50s, and winds change from southerly to northerly.
Readers may have had a difficult time trying to locate the warm front. Indeed it shows a very subtle temperature shift and almost no pressure trough and no significant wind shift. An excellent analysis trick for locating weak fronts is to set up an imaginary road trip that transects the frontal region and think about the weather changes at stops along the way. For example if we travel from Oklahoma to Michigan, we would find that temperatures remain in the 60s for much of the trip, but passing through Illinois we would notice a sharp drop in temperatures from about 66 in the St. Louis region to 54 near Champaign, Ill. and 43 in Detroit. Since the front lies on the warm side of the transition, we would place the front where we first noticed the temperature fall: just east of the St. Louis region. The area ahead of the warm front shows a classic pattern from meteorology textbooks: low clouds, rain, and drizzle. Ceilings here average 500 to 4000 ft, consisting largely of stratus and stratocumulus. Extensive low ceilings across a large region can be a remarkably accurate indicator of the approach of a warm front.
The warm front intersects the cold front in southeast Minnesota, forming what is known as a "triple point". The isobaric analysis shows a distinct concavity of the lines around the triple point, a feature which suggests the possibility of a weak low pressure center at the triple point. Even though the triple point does not look very interesting on the surface chart, it is the single most important area for low-pressure development within a frontal system. This is because it is at the juxtaposition of the warm and cold air masses, known as a baroclinic zone. Quite often a forecaster can expect cyclogenesis (baroclinic development) at the triple point with falling pressures, development of a low, and deteriorating weather, especially where an approaching upper-level disturbance supports the pressure falls.
Further north in Canada, the cold front seems to extend from Minnesota northward. Since this part of the surface front is physically separated from the warm air mass and is poleward of the triple point, this front is actually an occluded front. For this reason it is colored purple and annotated with both the warm and cold front barbs. As with all occluded fronts, the surface chart shows cool air of polar origin on either side of the boundary
Even further north is a deep low pressure system over central Manitoba. Though this low pressure area looks quite formidable, it is actually a frontal low pressure area in its dying stage. When new cyclogenesis occurs along a baroclinic zone, a low pressure center develops and the warm and cold air masses converge into the low. However eventually the cold air wraps completely around the low, homogenizing the temperature contrasts. The low becomes physically removed fron the warm-cold air interface and is no longer in a barotropic zone. This is what is occurring with the Manitoba low. Such lows tend to drifts in a poleward direction, its pressures rise, the occluded front loses definition, and the low decays. Hudson Bay, Baffin Bay, and much of northeast Canada is a perpetual graveyard for old cyclones that have raked the United States in days past, and there they tend to weaken and drift slowly until they no longer can be identified on the charts.
Computer programs do not produce the Forecast Center solutions. All fronts and isobars are manually drawn by the author using illustration software.
Click to enlarge
©2008 Taylor & Francis
All rights reserved