Forecast Center
March/April 2008
by TIM VASQUEZ / www.weathergraphics.com
|
This article is a courtesy copy placed on the author's website for educational purposes as permitted by written agreement with Taylor & Francis. It may not be distributed or reproduced without express written permission of Taylor & Francis. More recent installments of this article may be found at the link which follows. Publisher's Notice: This is a preprint of an article submitted for consideration in Weatherwise © 2008 Copyright Taylor & Francis. Weatherwise magazine is available online at: http://www.informaworld.com/openurl?genre=article&issn=0043-1672&volume=61&issue=2&spage=82. |
PART ONE: The Puzzle
The Forecast Center moves to the European continent for this issue. Weather in that part of the world tends to be mild and stagnant during the warm season, earning the region its distinction as a favored summer tourist destination. But the tables are turned during the winter months. Powerful weather systems develop across the Atlantic Ocean and regularly sweep across Scandinavia, the British Isles, and France, causing significant economic losses every year due to shipping delays, electrical interruptions, and damage. An Atlantic storm on January 31, 1953, for example, brought one of the worst modern-day natural disasters ever to affect Europe, killing over 2000 and causing billions of dollars in damage. Though no such tragedy has occurred so far this season, this puzzle illustrates one noteworthy example of an intense European storm.
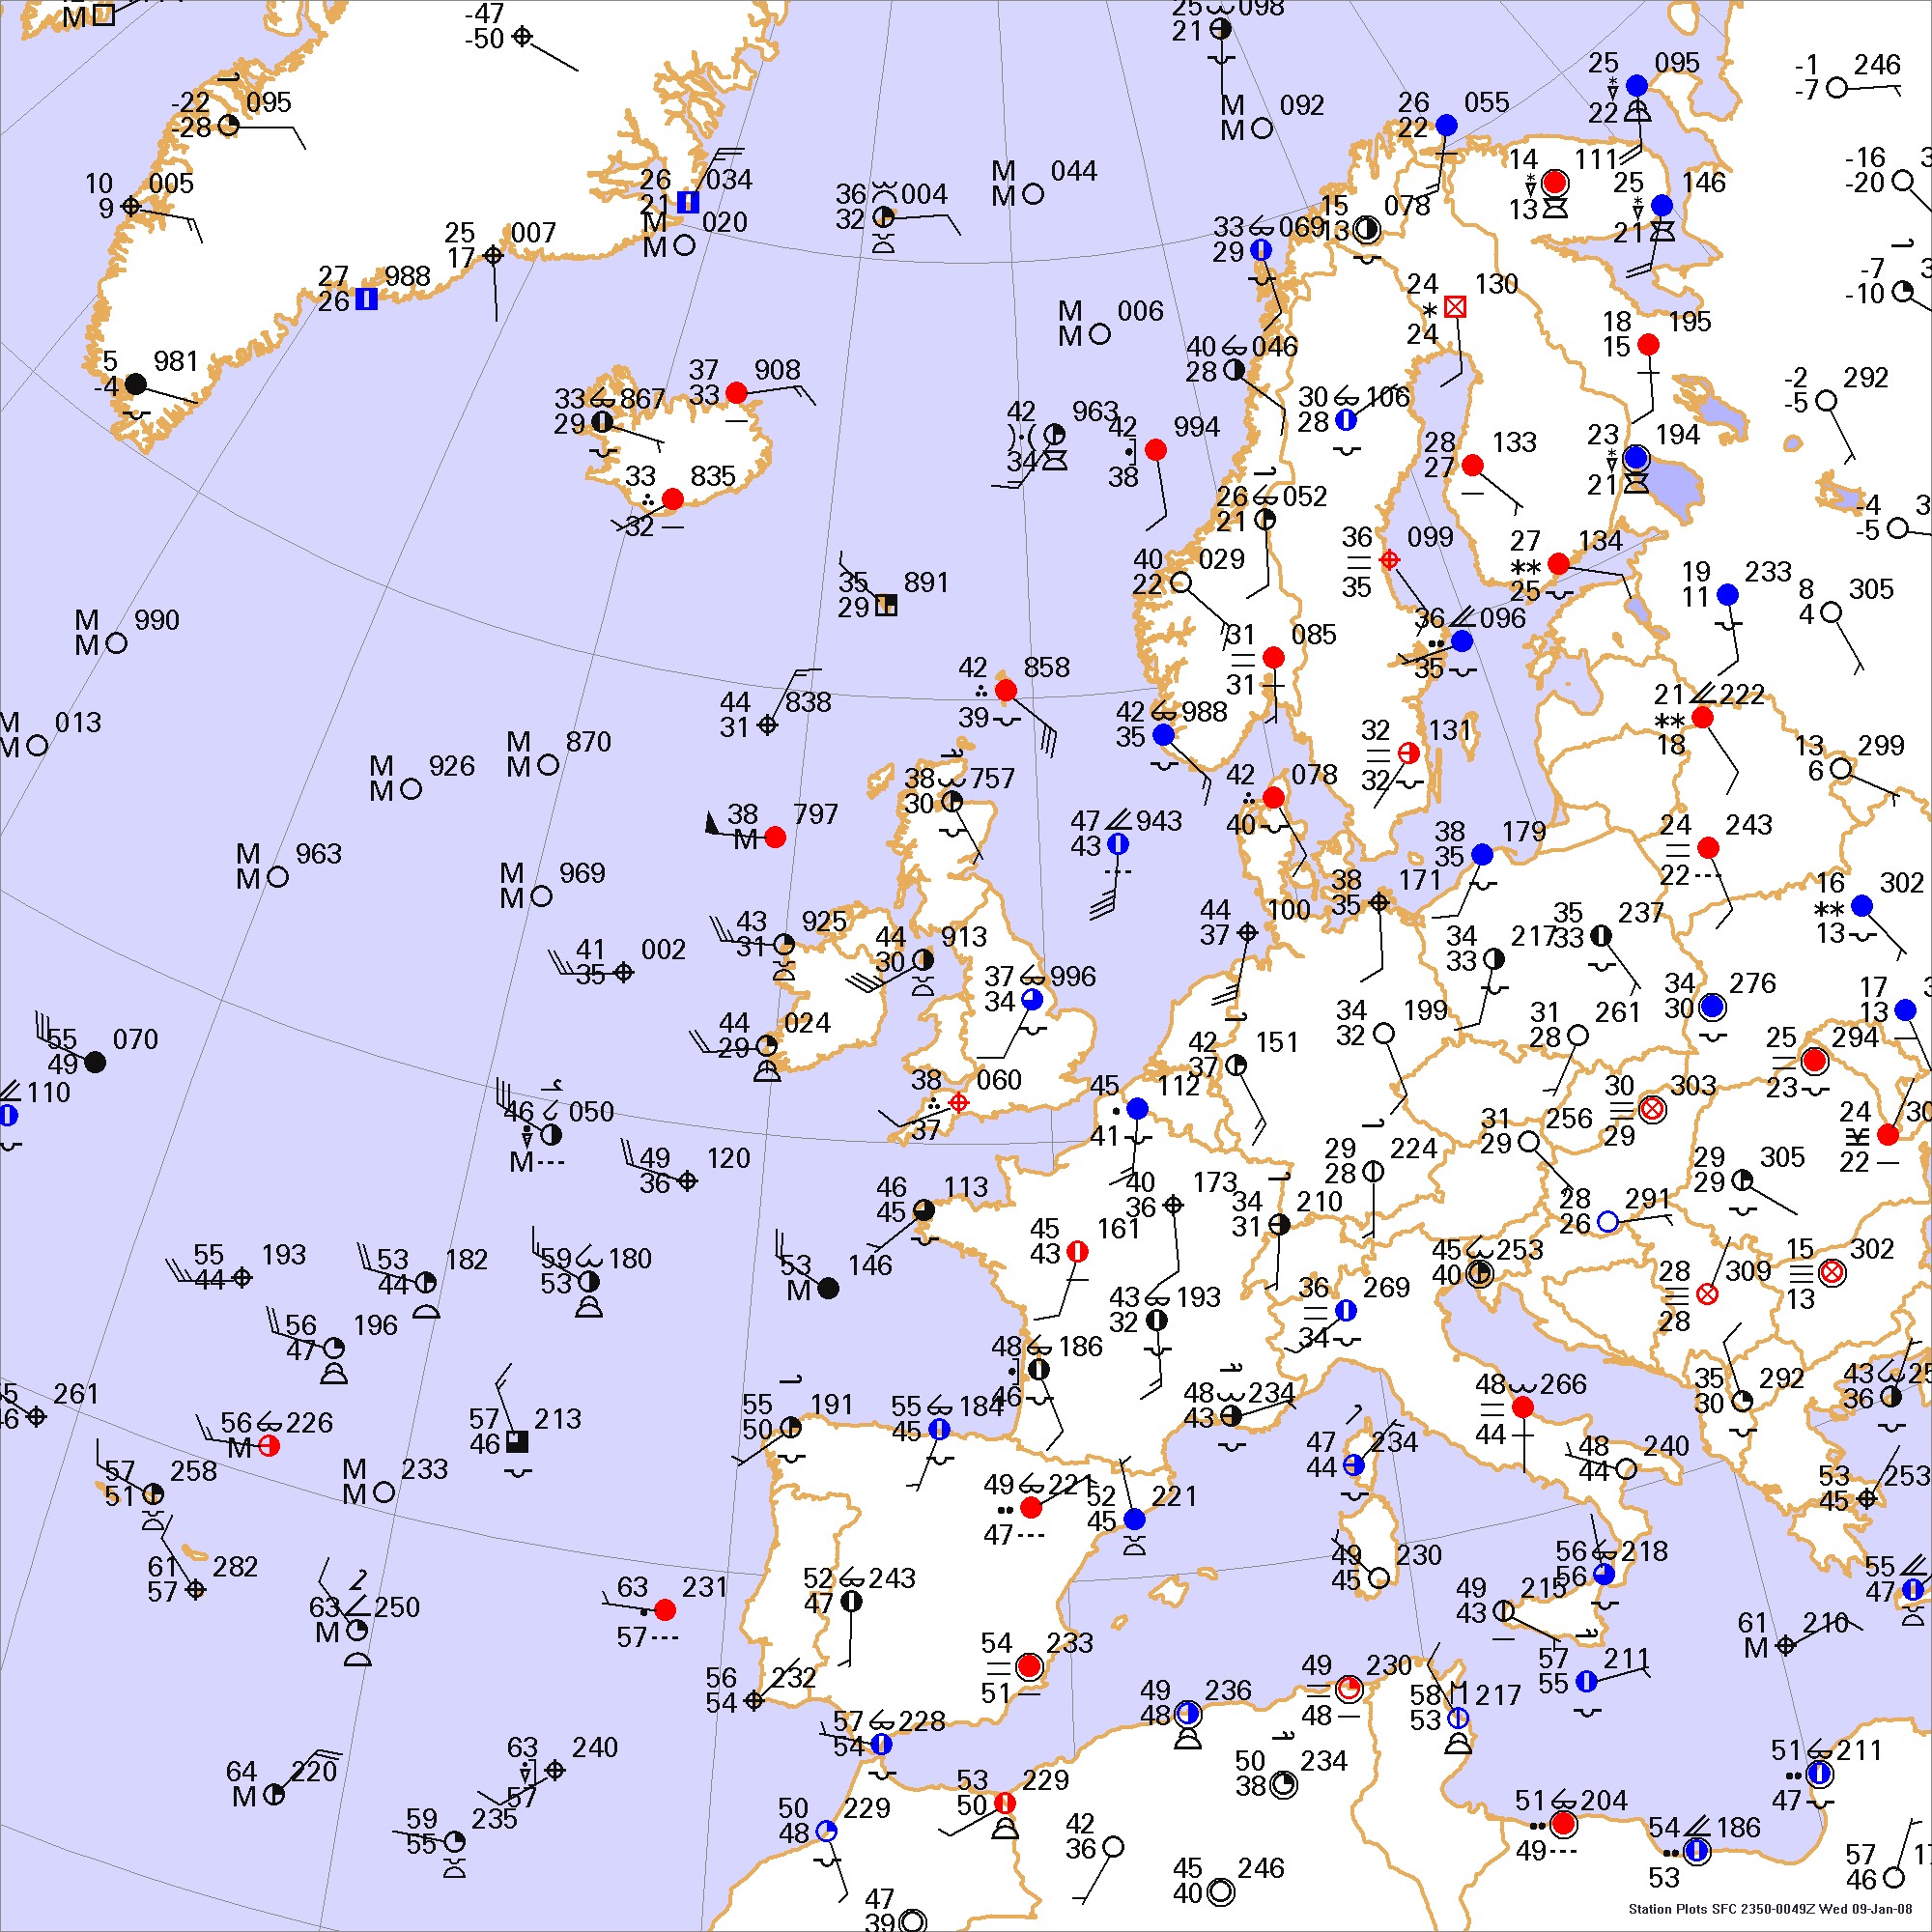
This weather map is an event during the overnight hours in January. Draw isobars every four millibars (1008, 1004, 1000, 996, etc.) using the plot model example at the lower right as a guide. As the plot model indicates, the actual millibar value for plotted pressure (xxx) is 10xx.x mb when the number shown is below 500, and 9xx.x when it is more than 500. For instance, 027 represents 1002.7 mb and 892 represents 989.2 mb. Therefore, when one station reports 074 and a nearby one shows 086, the 1008 mb isobar will be found halfway between the stations. Then try to find the locations of fronts, highs, and lows.
Click to enlarge

* * * * *
Scroll down for the solution
* * * * *
PART TWO: The Solution
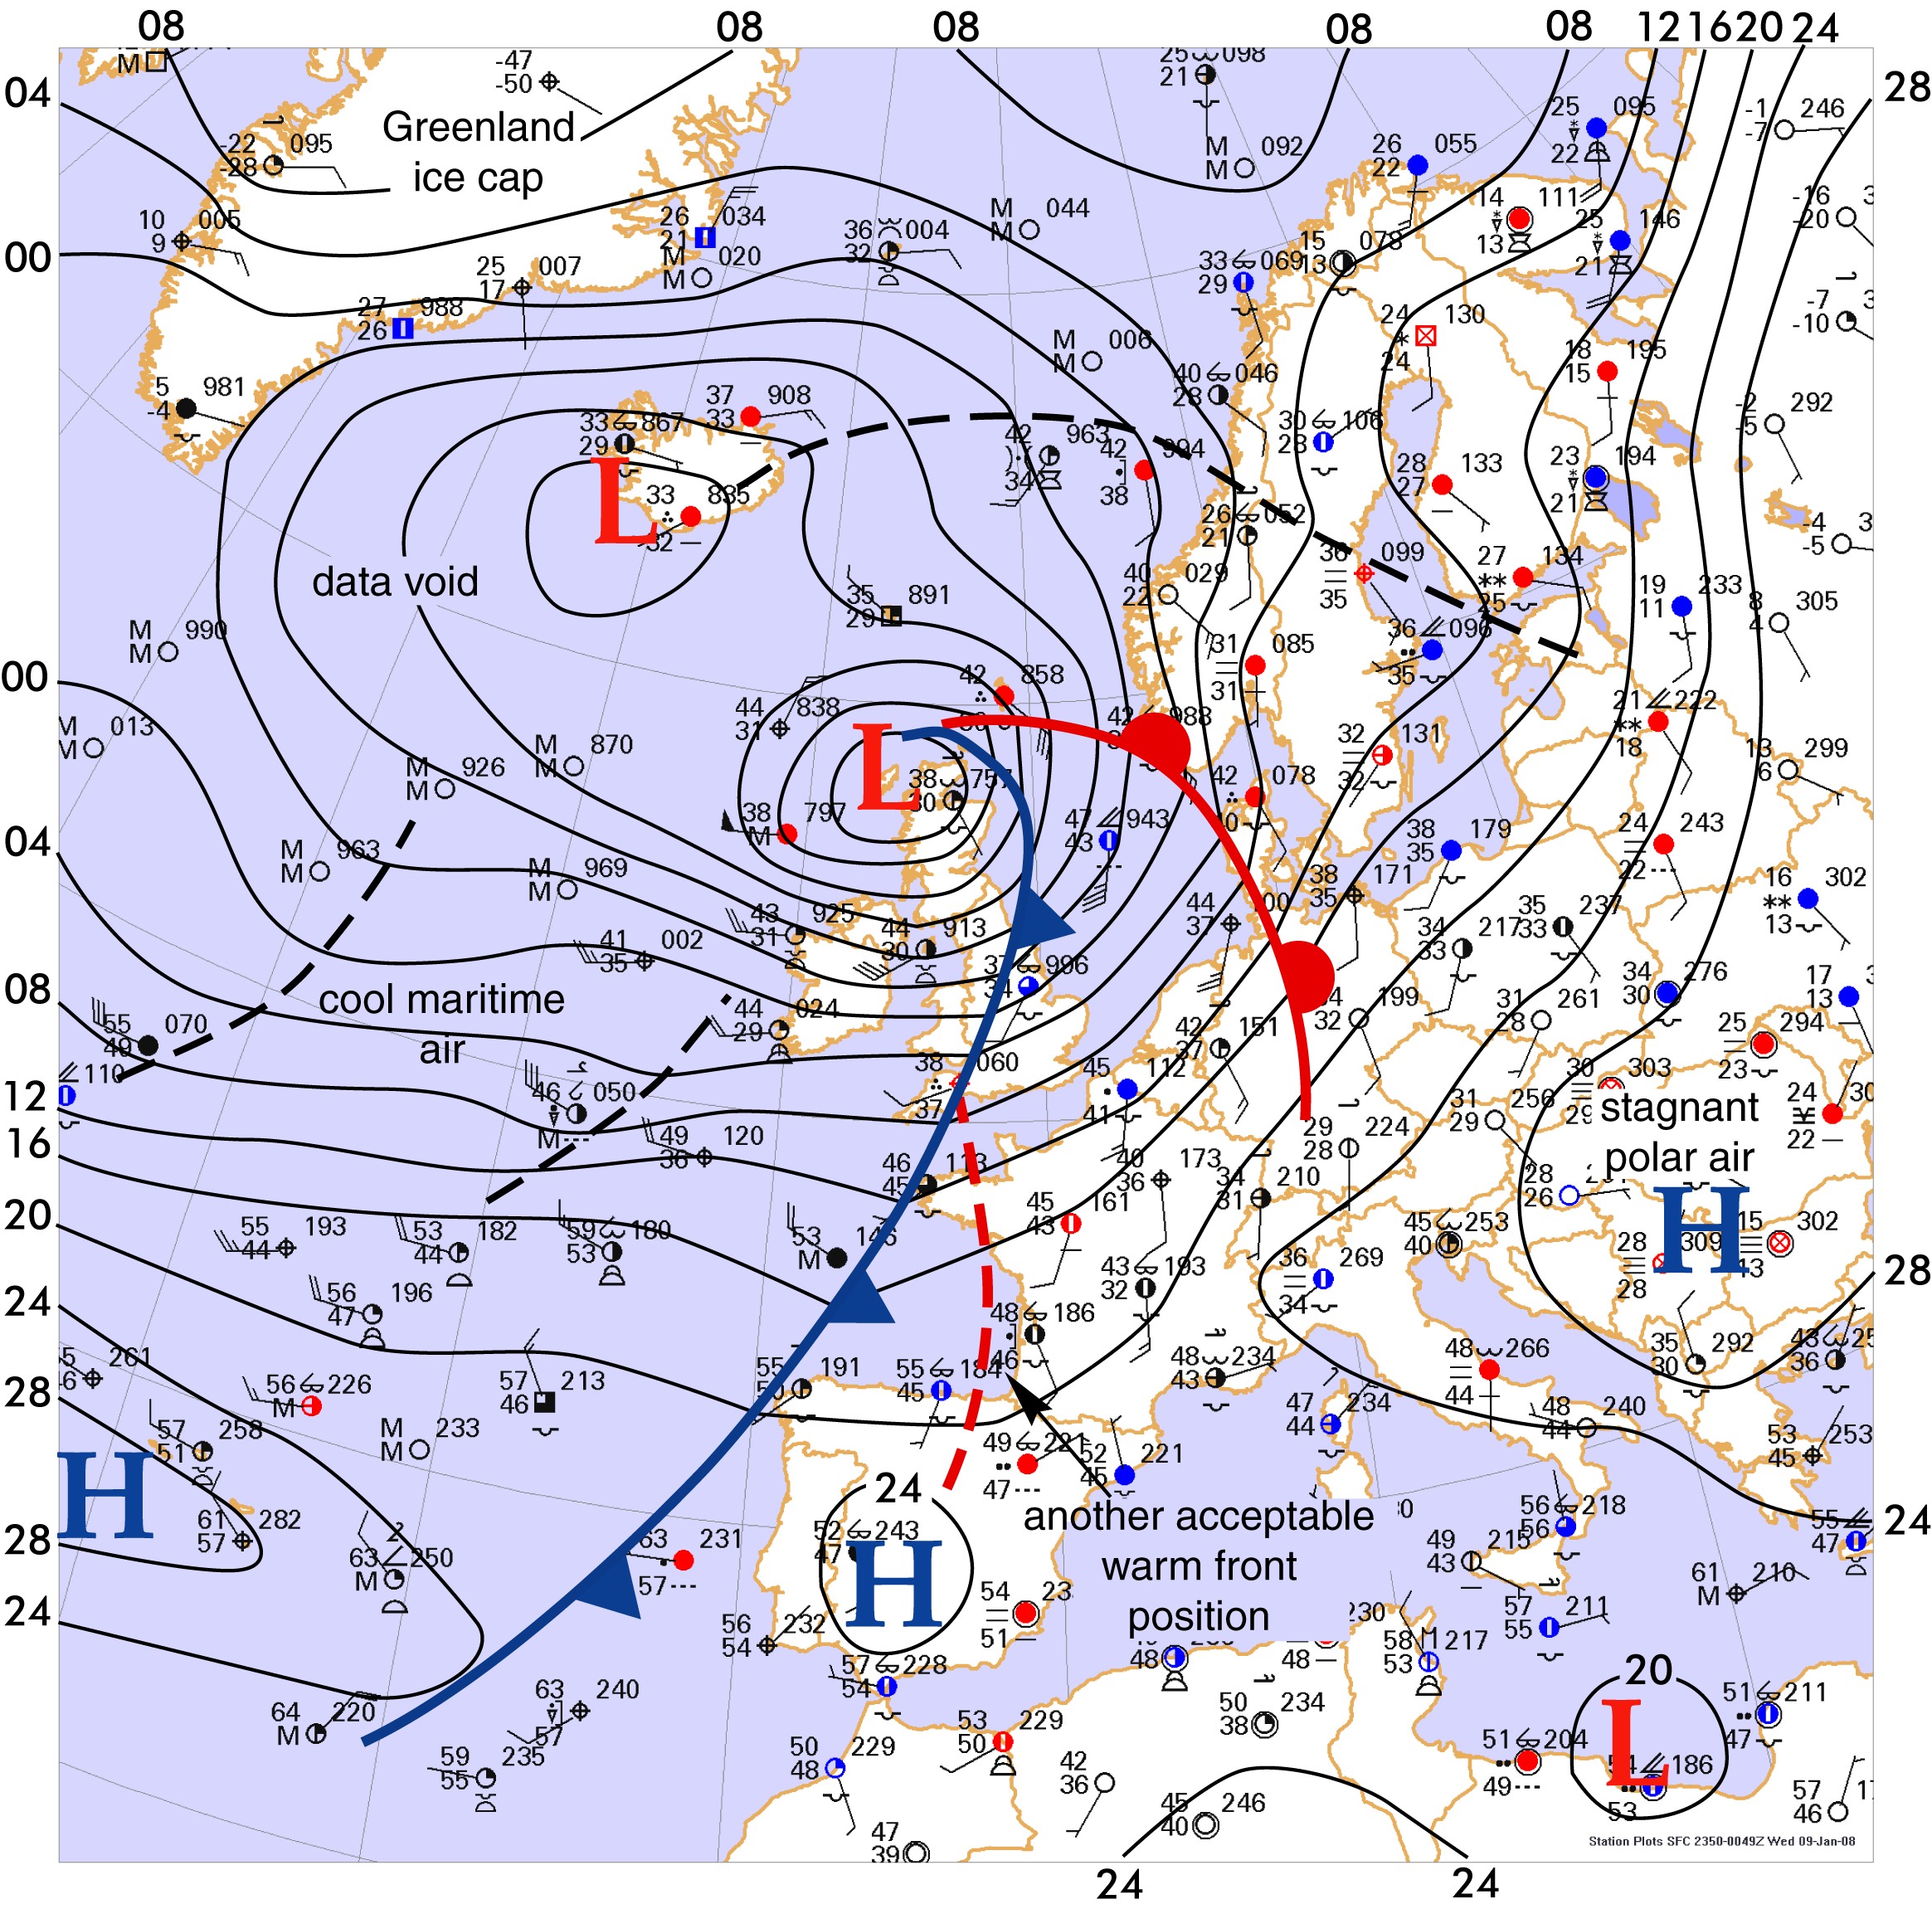
The early morning hours of January 9, 2008 showed a turbulent pattern on the European weather maps. An intense low pressure area of 979 mb was moving across Scotland. In Glasgow, wind gusts reached 83 mph, partially destroying one of the city's best-known landmarks, the Great Eastern Hotel. Ferry services between Scotland, Northern Ireland, and the Hebrides were suspended. Snow resulted in some road closures throughout Scotland, and the Cairngorms ski resort recorded a peak wind gust of 140 mph. According to the British Met Office, the low pressure center had dropped to as low as 965 mb. This is a pressure reading often associated with Category 3 hurricanes in North America.
Such powerful weather systems are generated when frigid air masses from the Greenland ice cap and the polar ice pack move southward and interact with the warm Gulf Stream waters. The Gulf Stream is a current that surges northeastward from the United States coastline towards Ireland, bringing water temperatures of over 50 degrees even in the middle of winter. The rapid heating of this air mass and the infusion of water vapor destabilizes the atmosphere and leads to rapid cyclogenesis. In turn, this creates strong frontal systems which feed upon the contrast between the cold polar air mass and the relatively warm air just to the south. Not surprisingly, death and disaster has always been a hallmark of the fishing trade in Scotland, Norway, and Ireland, with the dangers recounted in traditional ballads, lullabyes, and folk tales.
In this puzzle, the actual fronts are difficult to locate. This is a fairly common problem in Europe, which has a strong maritime influence and rarely gets the well-defined fronts found in the United States and Canada. For example, there is a fairly strong trough extending from England southwestward into the Atlantic, which is probably the most visible evidence of the cold front. Some readers may have glanced at the 45-degree weather in France and at the 55-degree weather northwest of Portugal and formed the impression that this cold front is ushering warmer air. However closer scrutiny of the plots just behind the front and looking "upstream" where the wind barbs point does indeed show cooler air on the way, such as in the Bay of Biscay where 53 degree temperatures are giving way to 46-49 degree readings upstream.
The warm front is even more difficult to locate. There is a rather smooth fall of temperatures all the way from Morocco to Scandinavia. Close to the low pressure center in Scotland, there is a sharp difference between the 47-degree temperatures in the North Sea and 30s in Scandinavia and east Europe, suggesting the warm front position as shown here. However since a warm front is technically located on the warm side of a gradient, an alternate location is shown in Spain, which is arguably correct too.
A strong pressure gradient exists across the British Isles, and is obvious from the "packing" of isobars close together. This packing implies a sharp change in pressure over a given distance: in this case from 979 mb in Scotland to 1006 mb in southern England, a difference of 27 mb over 500 miles. If we actually solved the equation for geostrophic wind balance with those figures, we would find a geostrophic wind speed of 42 mph, which suggests the winds would be 42 mph across the British Isles if friction were disregarded and there were no other influences acting on the air. Fortunately the winds diminished as the low pressure center moved northeast towards Norway, bringing some relief to the British islands.
The map also shows a very large cold air mass covering much of eastern Europe, with extensive cloud cover and fog. This is actually a very common situation in the winter months, caused when deep cold air outbreaks manufactured in Siberia work westward into Europe and then stagnate, followed by the arrival of strong westerly winds from the Atlantic that impinge on this air mass. This forms a textbook warm front weather regime with cold air in eastern Europe and warm air in western Europe. This pattern is responsible for much of the dreary, dark weather that continental Europe experiences in the winter. Though the cold air is quick to retreat across France and Germany, the cold air has a tendency to become trapped within the rugged terrain of eastern Europe. This forms persistent inversions and foggy weather that can last for weeks in places like Hungary and Serbia.
Computer programs do not produce the Forecast Center solutions. All fronts and isobars are manually drawn by the author using illustration software.
Click to enlarge
©2008 Taylor & Francis
All rights reserved