Forecast Center
September/October 2008
by TIM VASQUEZ / www.weathergraphics.com
|
This article is a courtesy copy placed on the author's website for educational purposes as permitted by written agreement with Taylor & Francis. It may not be distributed or reproduced without express written permission of Taylor & Francis. More recent installments of this article may be found at the link which follows. Publisher's Notice: This is a preprint of an article submitted for consideration in Weatherwise © 2008 Copyright Taylor & Francis. Weatherwise magazine is available online at: http://www.informaworld.com/openurl?genre=article&issn=0043-1672&volume=61&issue=5&spage=70. |
PART ONE: The Puzzle
Inspired by the legendary Calvin & Hobbes cry of "Yukon ho!" Forecast Center follows the compass needle north to the taiga forests and tundra of the Arctic Circle. Though these regions are remembered for the cold winter blasts they bring to much of North America, the meteorological patterns in these territories are forgotten by many weather enthusiasts during the calm summer months. However, these months bring a heightened tempo of frontal passages, jet streams, and even showery weather. The rapidly changing weather keeps Canadian meteorologists on their toes at a time when much of the United States has fallen under the influence of upper-level ridging, the Bermuda high, and southwestern heat low.
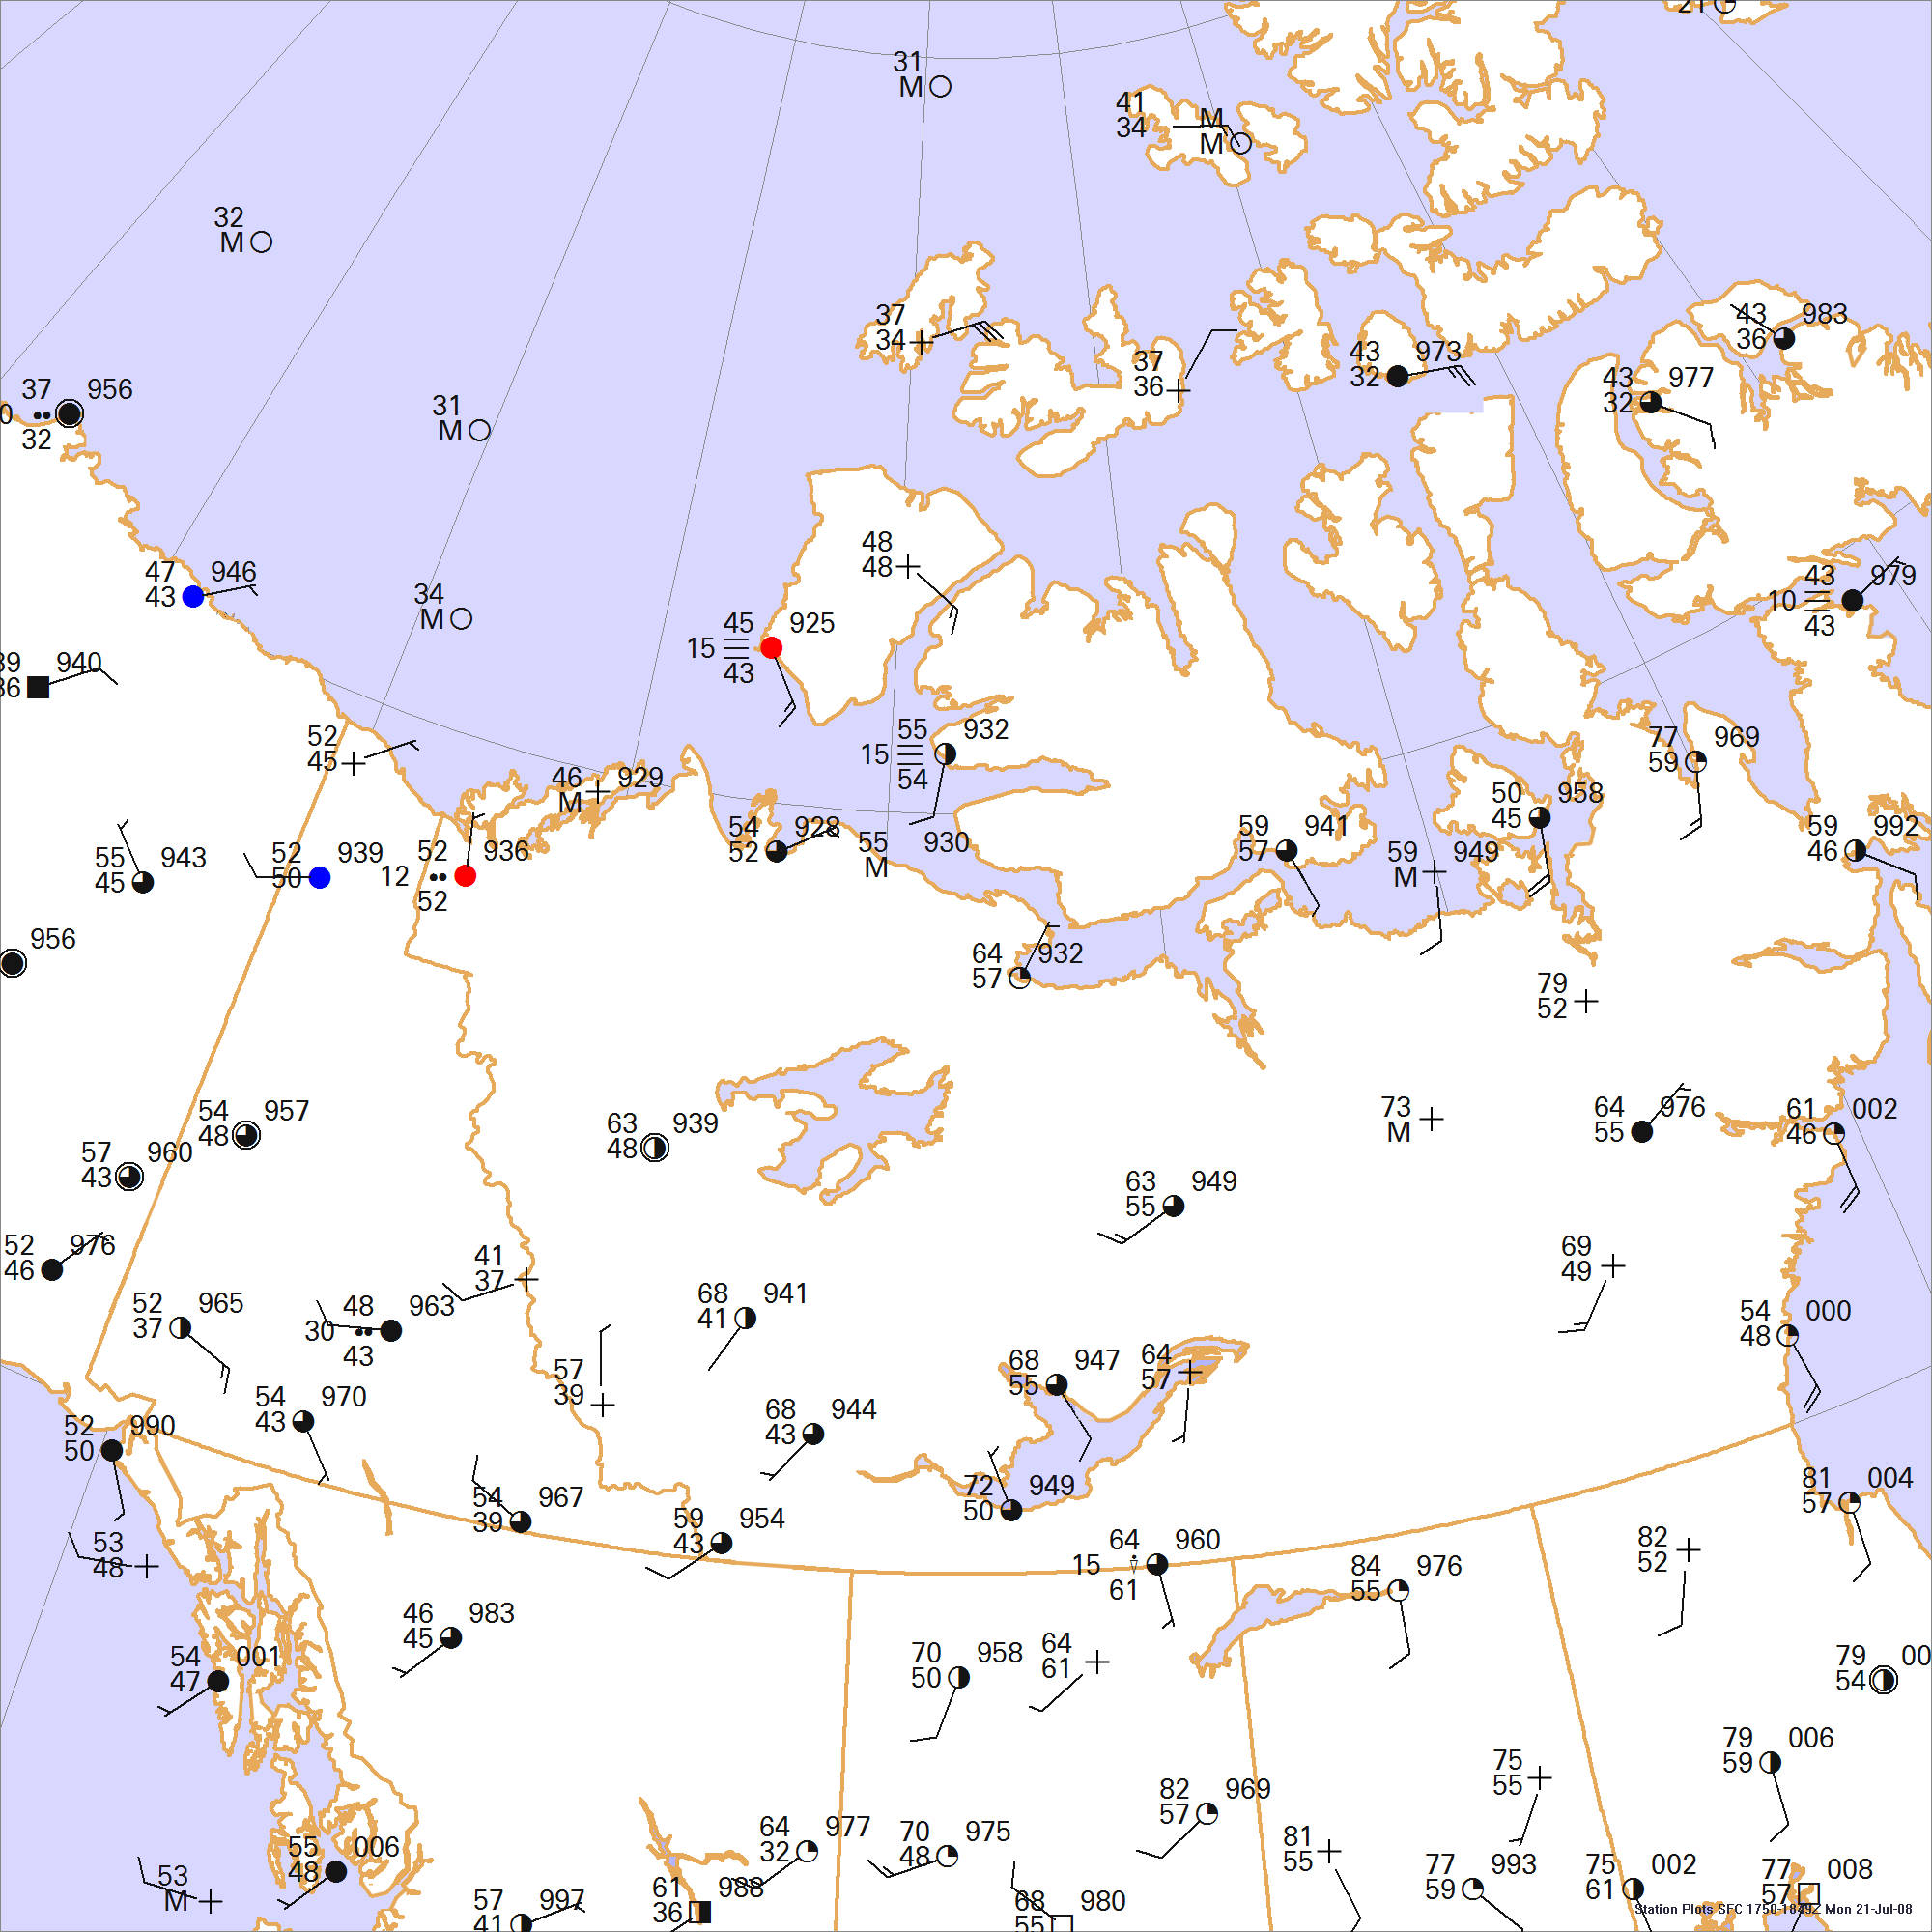
This weather map is an event during the mid-afternoon in July. Because pressure patterns are weak during the summer, draw isobars every two millibars (1004, 1002, 1000, 998, 996, etc.) using the plot model example at the lower right as a guide. As the plot model indicates, the actual millibar value for plotted pressure (xxx) is 10xx.x mb when the number shown is below 500, and 9xx.x when it is more than 500. For instance, 027 represents 1002.7 mb and 892 represents 989.2 mb. Therefore, when one station reports 074 and a nearby one shows 086, the 1008 mb isobar will be found halfway between the stations. Then try to find the locations of fronts, highs, and lows.
Click to enlarge

* * * * *
Scroll down for the solution
* * * * *
PART TWO: The Solution
The weather chart for July 21, 2008 reflects characteristics of a semi-permanent pattern found during the summer months: low pressure across land masses and high pressure offshore. Such a pattern arises due to the earth's surface broiling under the sun, creating a heat low at the surface, while air over the ocean waters remains relatively cool and dense. In these northern latitudes the late July daylight hours are long, with the capital of the Northwest Territories receiving 18 hours of sunshine and the Arctic Ocean shores receiving almost a full 24 hours of illumination.
During a stagnant warm season weather pattern, the drier terrain of Yukon and the western Northwest Territories warms rapidly from daily solar heating. As a result, a long, semipermanent trough is often found in this region. Furthermore, pressure falls caused by prevailing westerlies exiting the Canadian Rockies results in frequent lee-side troughing through much of Alberta. These two features often couple to produce an elongated trough that commonly extends from Alberta to the Alaskan interior during the summer months. A slow infusion of warm moist air into this trough often leads to clouds, showers, and even a few afternoon thunderstorms. The activity tends to follow the axis of the trough from day to day, but the pattern is sometimes broken up as weather systems move through, as shown on this particular day.
Southern Nunavut, the continental region shown on the east side of the chart, was baking under unseasonably hot readings. The map shows a pronounced incursion of warm air northward to the Arctic Ocean. The town of Kugaaruk (Pelly Bay) showed 77 degrees at map time but went on a few hours later to reach 81 degrees, tying an all-time record for July and coming within three degrees of the historical all-time record. Readings in the 70s and 80s were found southward to Saskatchewan and Manitoba. The warm conditions were made possible by strong solar heating and a long fetch of south winds extending to the United States, bringing modified tropical air northward.
During the summertime a cold dome of air is often present over Hudson Bay, where water temperatures are in the 40s in July. This chills the layer of air above Hudson Bay. Even with strong heating in coastal locations, the cold dome spreads inland in the form of a sea breeze. On this particular day, the prevailing south-to-north flow spared Manitoba from the cold dome, allowing temperatures at the polar bear viewing haven of Churchill to soar into the 80s. The cold dome instead spread into northeast Nunavut, keeping daytime highs in the 50s and 60s along the northwest coast. Though the cold dome mainly affects thermometers, clouds and drizzly weather can develop where warm surface flow impinges on the cold dome, producing slow, sustained lift of the type seen along classic warm fronts.
Further west, the pattern was changing due to a frontal system crossing the Northwest Territories, ushering in cool conditions from the Pacific, westerly winds, and slightly below average temperatures. As with nearly all Pacific systems, the Canadian Rockies forms a massive barrier to systems arriving from the Pacific. Most of the moisture is left behind on the coastal ranges, leaving mostly middle and high altitude clouds emerging onto the Canadian prairie. This is illustrated by the dry 30s and 40s dewpoints from Alberta northwestward even in spite of mostly cloudy conditions.
North of the Yukon, the frontal system had occluded, with a low pressure area marking the location of a dying frontal low. The unstable conditions associated with the cold upper level temperatures near this occluded low allowed the formation of cumuliform clouds and showery weather throughout coastal Yukon and the northwestern Northwest Territories. While Canadian wintertime lows usually spend the last days of their lives over the relatively warm waters surrounding southern Greenland, summertime lows tend to wander aimlessly over the high arctic islands, bringing the occasional dose of unpredictable weather to these northern communities.
Computer programs do not produce the Forecast Center solutions. All fronts and isobars are manually drawn by the author using illustration software.

Click to enlarge
©2008 Taylor & Francis
All rights reserved