Forecast Center
November/December 2008
by TIM VASQUEZ / www.weathergraphics.com
|
This article is a courtesy copy placed on the author's website for educational purposes as permitted by written agreement with Taylor & Francis. It may not be distributed or reproduced without express written permission of Taylor & Francis. More recent installments of this article may be found at the link which follows. Publisher's Notice: This is a preprint of an article submitted for consideration in Weatherwise © 2008 Copyright Taylor & Francis. Weatherwise magazine is available online at: http://www.informaworld.com/openurl?genre=article&issn=0043-1672&volume=61&issue=6&spage=70. |
PART ONE: The Puzzle
The United States does not lie in the tropical latitudes, but American forecasters must be well-versed in tropical weather phenomenon. Most of the time this type of weather comes in the form of subtropical highs which bring dull, hot conditions. There are also easterly waves which often rake the Gulf coastal region with showers and thunderstorms. This issue, however, introduces a tropical cyclone and illustrates its effect on meteorological charts.
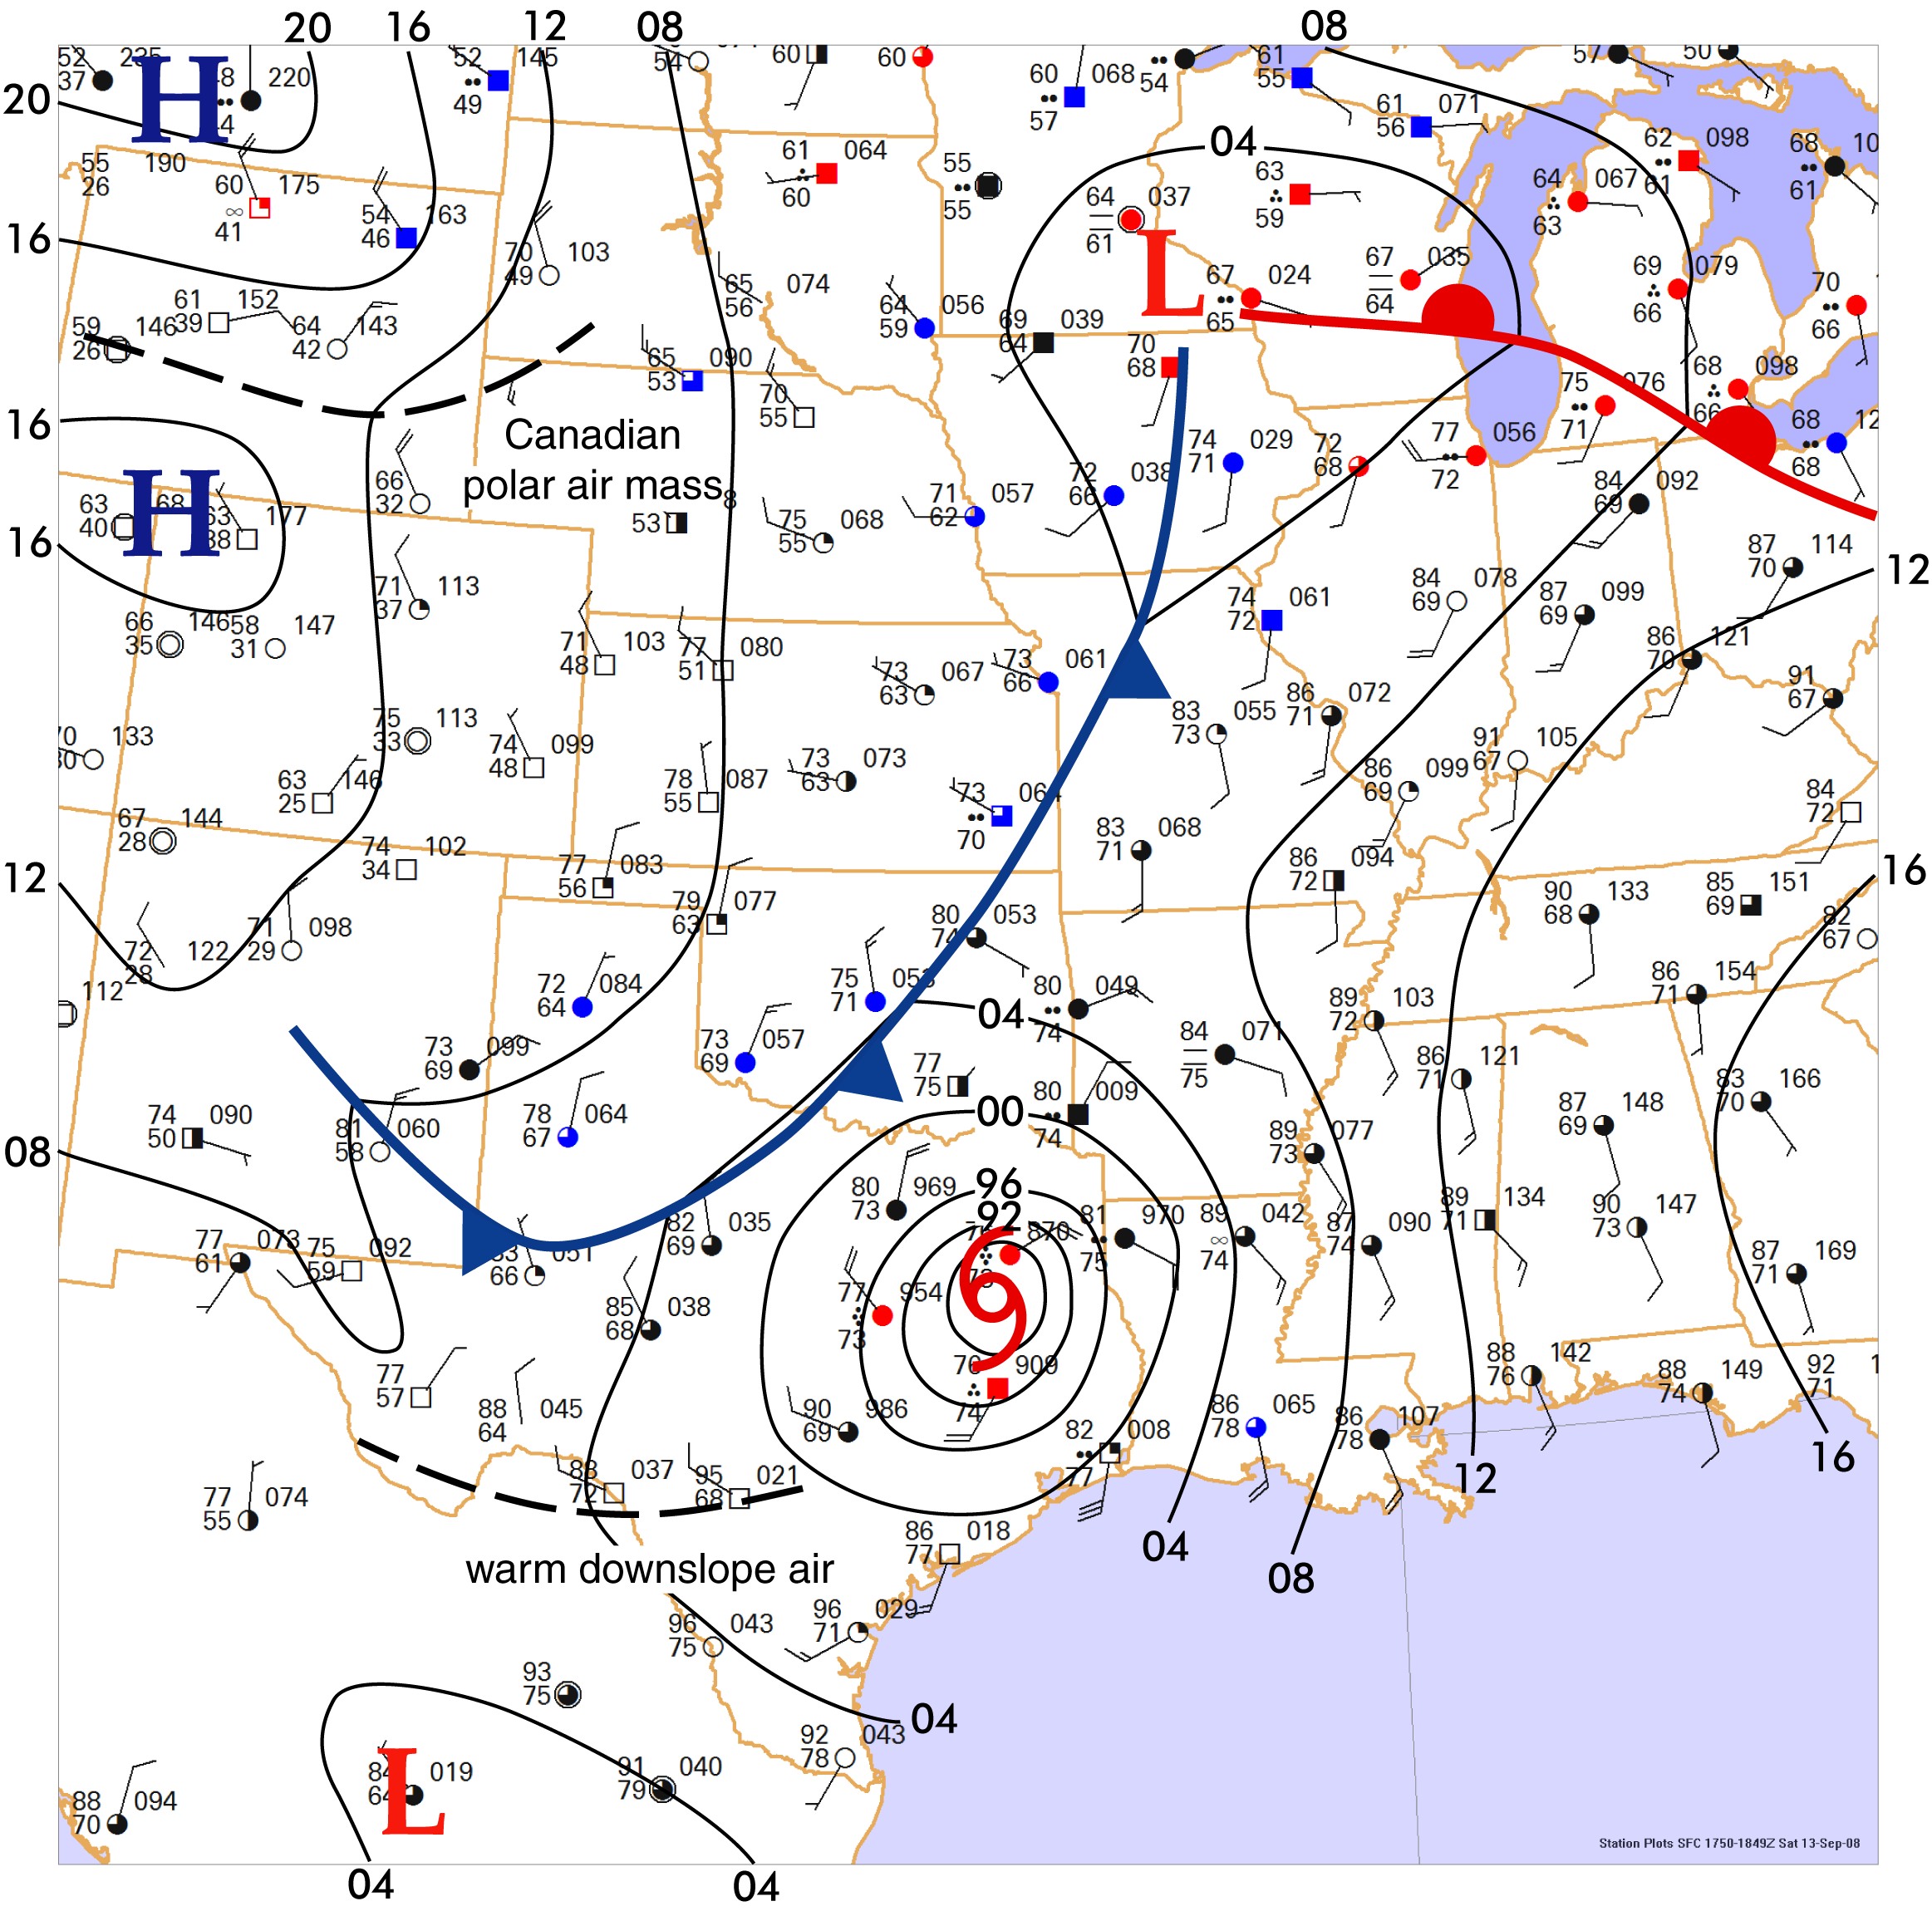
This weather map is an event during the afternoon hours in September. Draw isobars every four millibars (996, 1000, 1004 mb, etc) using the plot model example at the lower right as a guide. As the plot model indicates, the actual millibar value for plotted pressure (xxx) is 10xx.x mb when the number shown is below 500, and 9xx.x when it is more than 500. For instance, 027 represents 1002.7 mb and 892 represents 989.2 mb. Therefore, when one station reports 074 and a nearby one shows 086, the 1008 mb isobar will be found halfway between the stations. Then try to find the locations of fronts, highs, and lows.

Click to enlarge

* * * * *
Scroll down for the solution
* * * * *
PART TWO: The Solution
The weather chart for September 13, 2008 showed a very deep low in east Texas. This deep low is actually the remains of Hurricane Ike, which during the previous night had made landfall near Galveston, Texas. The storm came ashore as a Category 2 hurricane but brought a tremendous storm surge that caused at least $30 billion in damage and left hundreds dead or missing.
The tropical cyclone is identified by the spiral symbol shown on the solution map. When the center of the spiral is filled, it indicates a hurricane with sustained winds of 65 knots or greater. When the center is hollow as shown, it indicates a tropical storm with sustained winds of 35 to 64 knots. The weakest variety, a tropical depression, is indicated with a standard "L" low pressure symbol. With this map alone there is not enough information to judge which type of tropical cyclone is present, so readers may use any of the three tropical cyclone symbols. At the time, though, Hurricane Ike had been downgraded to a tropical storm by the National Hurricane Center.
Though inland, the danger from the storm is not over. The outer periphery of the storm, particularly ahead and to the right, can be favored areas for storms with brief tornadoes. The weakening wind circulation is still quite active and locations near the former eye can experience damaging wind gusts. The biggest threat, however, comes from heavy precipitation. Tropical cyclones are notorious for carrying massive amounts of precipitable water inland, even from the Pacific Ocean across the Mexican Sierra Madre range into New Mexico and Texas. Tropical Storm Claudette in July 1979 was responsible for the heaviest 24-hour rainfall ever observed in the continental United States: 43 inches.
With such a deep low pressure system, readers get an excellent opportunity to practice reading the sea-level pressure numbers on the station plots. The lowest pressure found is 987.0 mb on the plot in east Texas. We can easily convert this to inches by dividing by 33.8636, yielding a result of 29.15 inches of mercury. It should be noted that sea-level pressure is not exactly the same thing as observed barometric pressure, because by definition sea-level pressure uses an artificial correction of the barometer to sea level which takes into account the current temperature and the temperature 12 hours ago, along with a set of climatological adjustments. This complicated scheme explains why some stations report "altimeter setting" (i.e. the disseminated barometric pressure), a simple conversion to sea-level pressure, but not sea-level pressure, like the station in central Wisconsin. In some cases it can be advantageous to do an analysis with altimeter setting instead of sea-level pressure.
When tropical cyclones move into temperate latitudes as shown here, it's quite common for dramatic air mass interactions to occur. In this case, a polar air mass over the Great Plains coupled with the northerly flow west of Tropical Storm Ike, resulting in a strong southward acceleration of the polar air mass into Texas. It's ironic that this tropical system hastened the arrival of unseasonably cold weather into the Lone Star State! The southwest quadrant of the storm brought air from the Mexican interior to lower elevations, with adiabatic heating sending the mercury into the 90s. On the eastern periphery of Tropical Storm Ike, a massive onshore advection of tropical air into the southeast United States sent dewpoint temperatures well into the mid-70s.
Readers will notice that isobars are not extended offshore. This is due to the lack of data in those areas. A standard meteorological convention is that isopleths are never drawn into areas without data. It may seem that numerical models break this rule all the time, but numerical models are not an actual analysis and represent a hypothetical atmosphere where all quantities throughout its domain are known.
Computer programs do not produce the Forecast Center solutions. The weather chart is created with Digital Atmosphere, then fronts and isobars are added with Adobe Illustrator.
Click to enlarge
©2008 Taylor & Francis
All rights reserved