Forecast Center
January/February 2009
by TIM VASQUEZ / www.weathergraphics.com
|
This article is a courtesy copy placed on the author's website for educational purposes as permitted by written agreement with Taylor & Francis. It may not be distributed or reproduced without express written permission of Taylor & Francis. More recent installments of this article may be found at the link which follows. Publisher's Notice: This is a preprint of an article submitted for consideration in Weatherwise © 2009 Copyright Taylor & Francis. Weatherwise magazine is available online at: http://www.informaworld.com/openurl?genre=article&issn=0043-1672&volume=62&issue=1&spage=70. |
PART ONE: The Puzzle
All eyes are on the seas when it comes to wintertime weather. The world's oceans, comprised of 300 million cubic miles of water, make up a massive storehouse of thermal energy. Even though landmasses cool rapidly, snowcover expands, and the polar icepack develops, the oceans feed enormous amounts of warmth back into the atmosphere on the open seas. This often destabilizes the atmosphere and produces clouds, fronts, and powerful weather systems. These seasonal characteristics were known even to the ancient Romans, who feared crossings of the Mediterranean during the cool season.
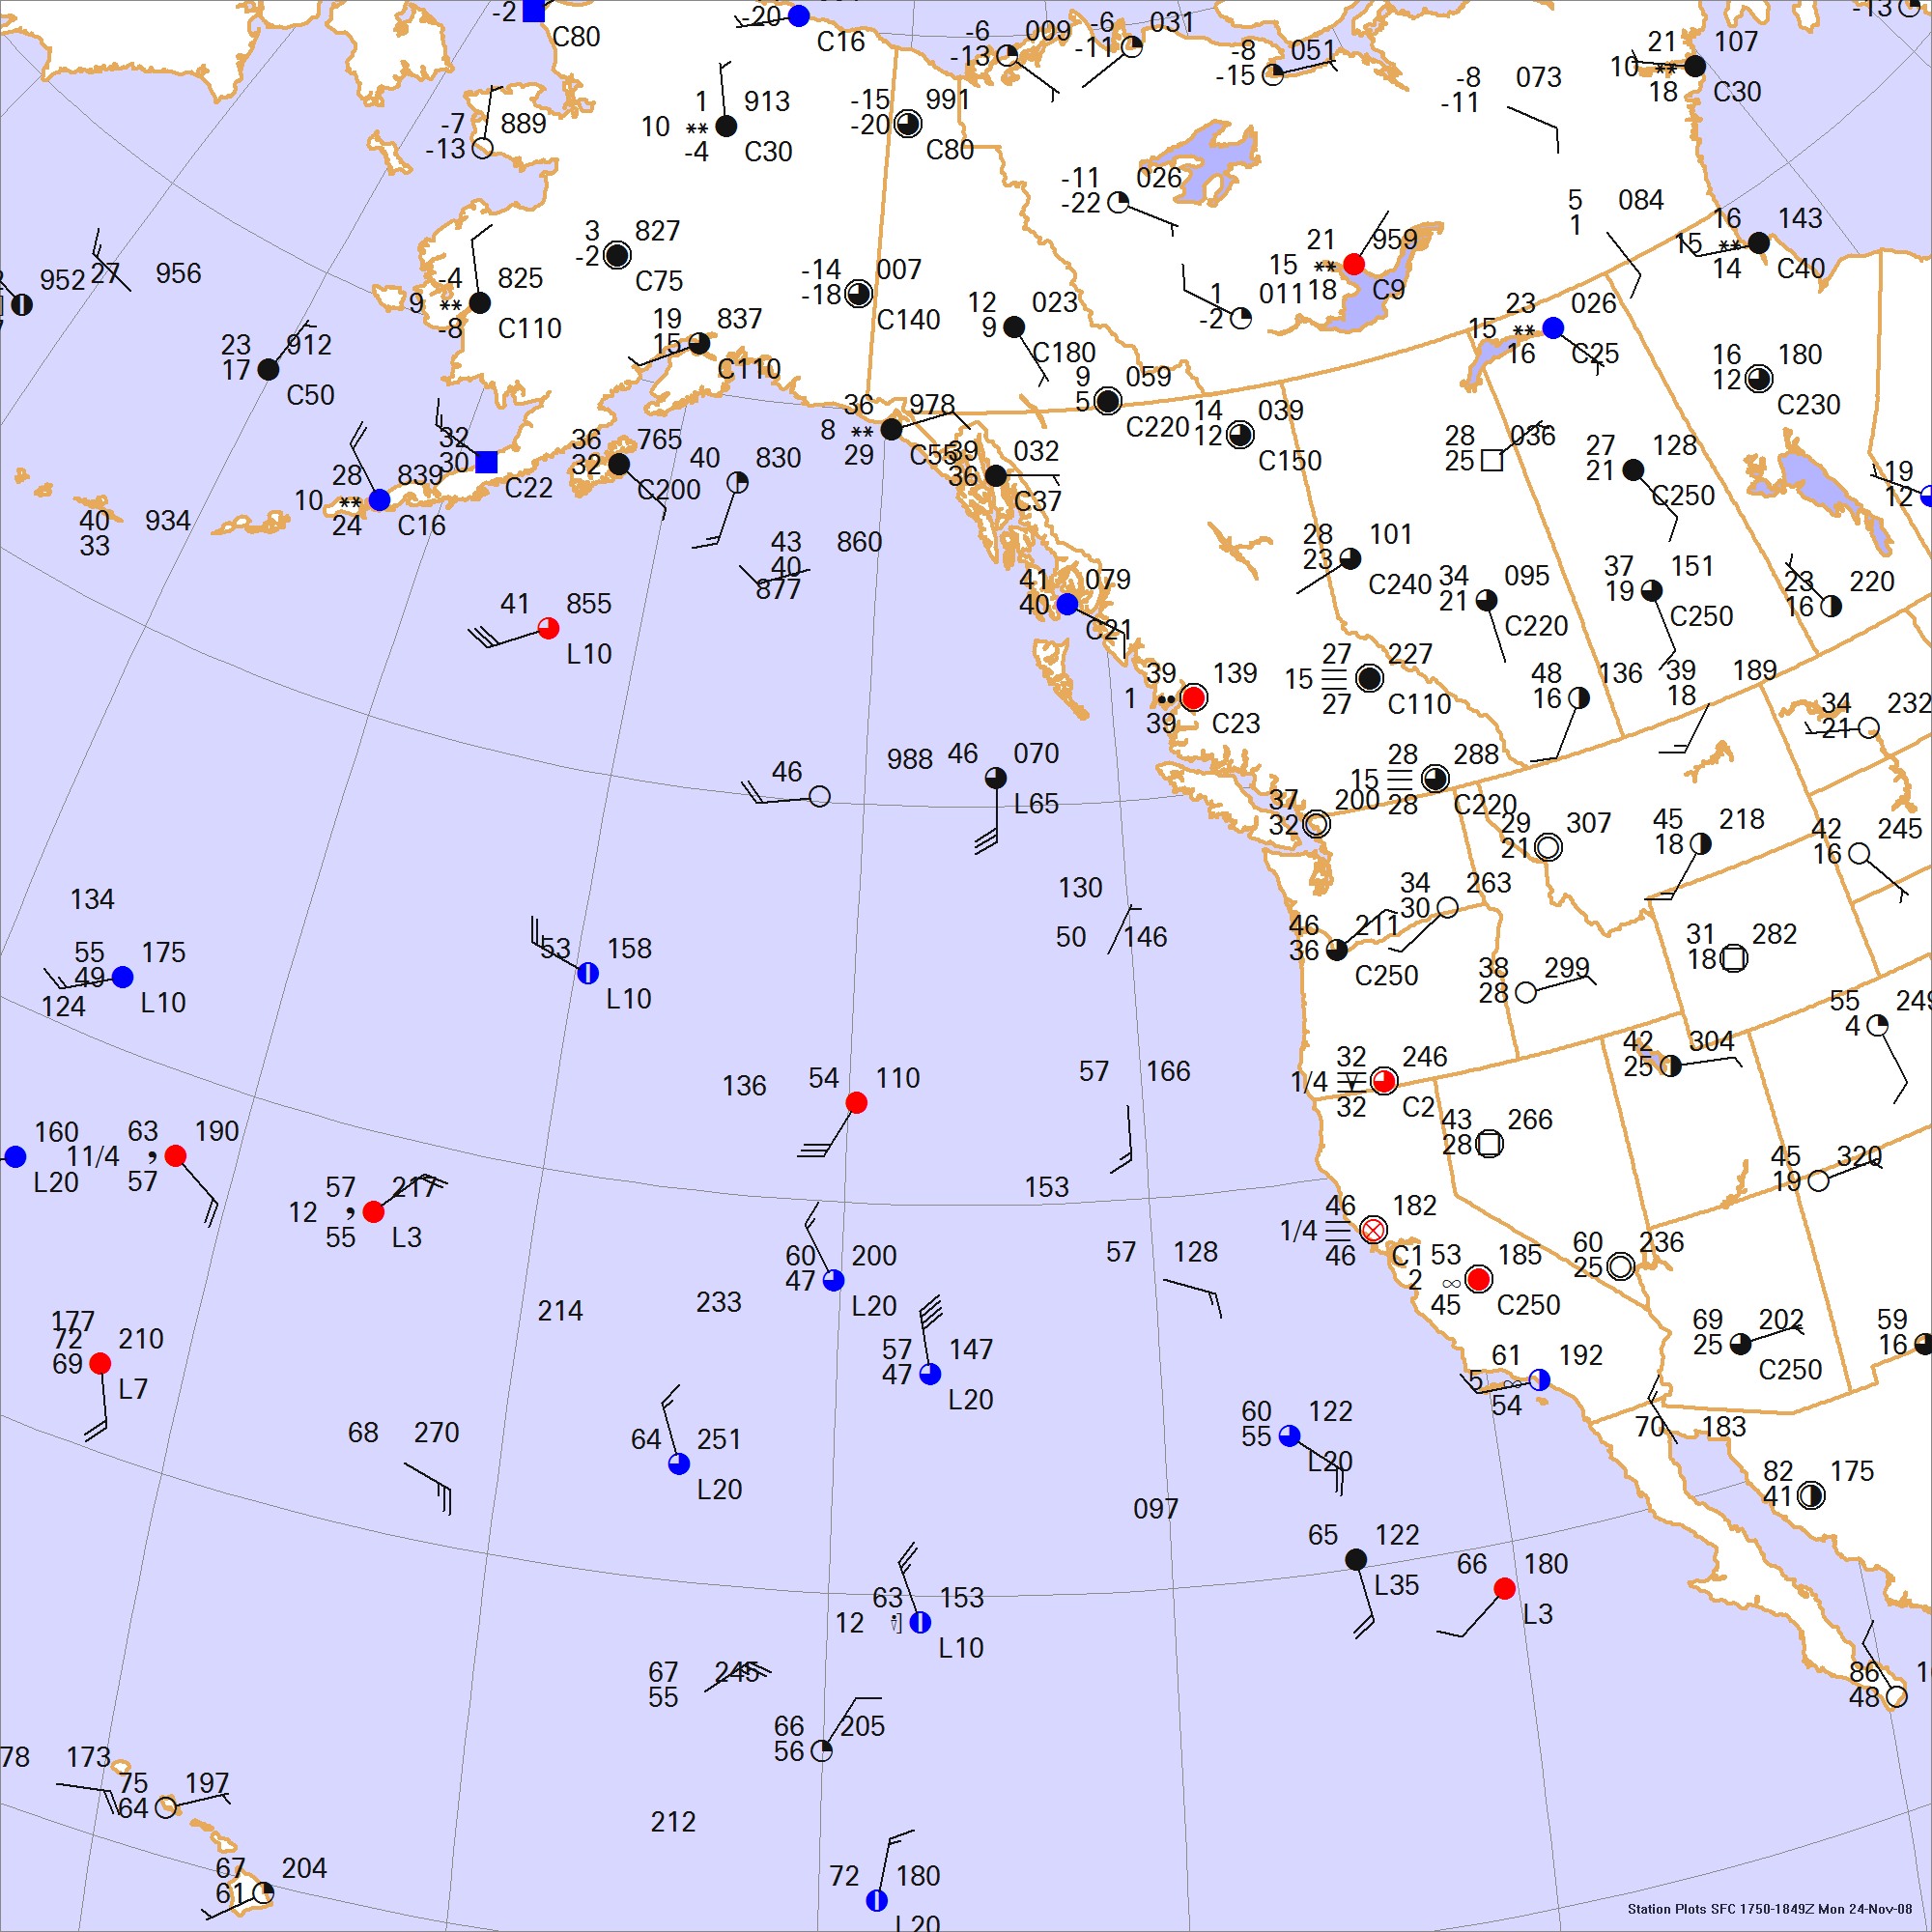
This weather map is an event during the afternoon in late November. Draw isobars every four millibars (996, 1000, 1004 mb, etc) using the plot model example at the lower right as a guide. As the plot model indicates, the actual millibar value for plotted pressure (xxx) is 10xx.x mb when the number shown is below 500, and 9xx.x when it is more than 500. For instance, 027 represents 1002.7 mb and 892 represents 989.2 mb. Therefore, when one station reports 074 and a nearby one shows 086, the 1008 mb isobar will be found halfway between the stations. Then try to find the locations of fronts, highs, and lows.
Click to enlarge

* * * * *
Scroll down for the solution
* * * * *
PART TWO: The Solution
The weather analysis for November 24, 2008 showed deep low pressure across the Pacific Ocean. The seas are usually quite stormy during the winter months because the atmosphere and land masses become significantly cooler than the oceans. The vast stores of water feed warmth back into the atmosphere, which causes thermal instability and the development of fronts and storm systems. Fronts which enter the oceans often intensify rapidly and develop deep low pressure areas along their length.
In this particular example, the lowest pressure found was a 976 mb low in the eastern Aleutian Islands. Many readers will have found a pressure trough extending southeastward, but will have trouble figuring out which type of front to draw. After all, temperatures are evenly in the 40s off the Canadian and Alaskan coasts and in the 50s westward from Washington and Oregon. A suggested configuration is shown here. These very deep lows are almost always occluded -- that is, they contain an occluded front formed from the merging of a cold and warm front. The tail end of an occluded front often contains an actual cold front and warm front pair, but it's often difficult to determine where this is without continuity and upper air charts. In this case the air temperature of 57 degrees off the Oregon coast appears to contrast strongly with the 46-degree reading off the British Columbia coast, suggesting the warm front is located in this area and producing the solution shown.
A cutoff low is seen southwest of the California coast. These systems are barotropic, having little in the way of surface fronts, but they can have minor temperature advection and weak frontal characteristics, so there is no fault in drawing a front near this low. Cutoff lows are responsible for most of the wintertime precipitation in the southwestern United States, and in this case the cutoff low reached the Los Angeles area the next day, bringing rain and thunderstorms. The western United States is covered by a stagnant plateau high. While it usually brings dry, cool, and monotonous weather to these regions, the dry air associated with the high can enhance evaporative cooling as coastal weather systems approach, lowering snow elevations and shaving 10 or 20 degrees off afternoon temperatures.
Hawaii, seen in the lower left of the chart, is usually out of reach of migratory frontal systems. But the powerful Pacific systems north of the islands produce long fetches of turbulent seas. This surf has considerable momentum and is within easy range of Hawaii, battering the northwest shores with high waves. It is a time of excitement among Hawaii's surfing community. Waimea Bay, on the northern Oahu shores, is one of the more popular surfing destinations in November through March, where waves can grow up to 30 feet tall. The trailing edge of large Pacific systems can also stagnate over the islands producing the "Kona storm", a wintertime rain event.
Elsewhere, a weak frontal system was found in northern Canada with a strong lee-side trough in Alberta and Montana. Lee-side troughs are usually found where strong upper-level winds cross perpendicular to a mountain range. The lee-side trough rarely produces storms or precipitation in the winter months, but it can bring unusually warm weather with temperature rises of 40 or 50 degrees in mere hours.
Computer programs do not produce the Forecast Center solutions. The weather chart is created with Digital Atmosphere, then fronts and isobars are added with Adobe Illustrator.

Click to enlarge
©2009 Taylor & Francis
All rights reserved