Forecast Center
July/August 2009
by TIM VASQUEZ / www.weathergraphics.com
|
This article is a courtesy copy placed on the author's website for educational purposes as permitted by written agreement with Taylor & Francis. It may not be distributed or reproduced without express written permission of Taylor & Francis. More recent installments of this article may be found at the link which follows. Publisher's Notice: This is a preprint of an article submitted for consideration in Weatherwise © 2009 Copyright Taylor & Francis. Weatherwise magazine is available online at: http://www.informaworld.com/openurl?genre=article&issn=0043-1672&volume=62&issue=4&spage=70. |
PART ONE: The Puzzle
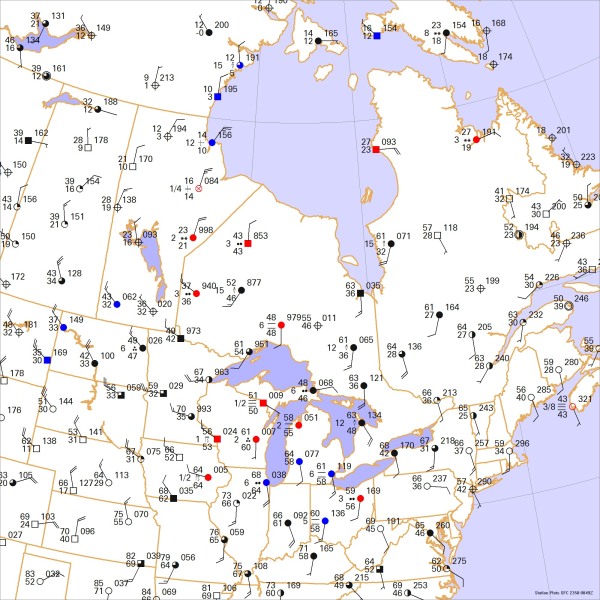
Even as summer approaches, all it takes is widespread snow cover and a couple of clear nights to generate prolific amounts of cold air in the Canadian arctic. Once this cold air moves south and interacts with warm spring air, very strong weather systems and powerful fronts can result. For this puzzle, we'll take a look at such a system that affected the northern United States in May 2009.
This weather map is an event during the early evening in May. Draw isobars every four millibars (996, 1000, 1004 mb, etc) using the plot model example at the lower right as a guide. As the plot model indicates, the actual millibar value for plotted pressure (xxx) is 10xx.x mb when the number shown is below 500, and 9xx.x when it is more than 500. For instance, 027 represents 1002.7 mb and 892 represents 989.2 mb. Therefore, when one station reports 074 and a nearby one shows 086, the 1008 mb isobar will be found halfway between the stations. Then try to find the locations of fronts, highs, and lows.

Click to enlarge

* * * * *
Scroll down for the solution
* * * * *
PART TWO: The Solution
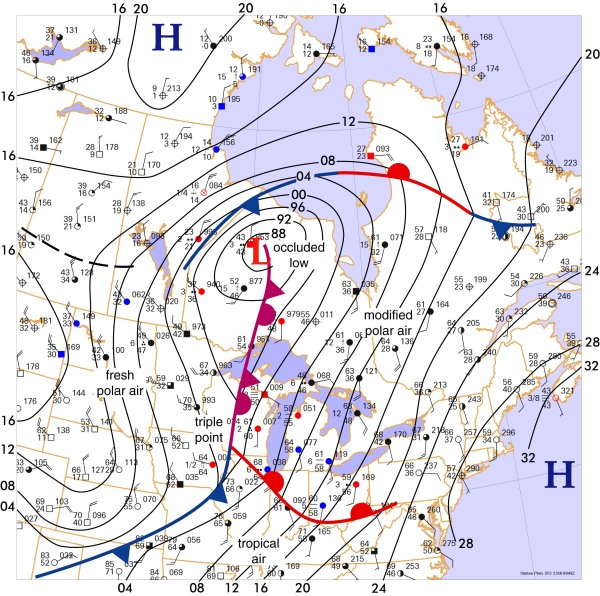
The weather map for the evening of May 13, 2009 showed a strong weather system moving through the Midwest, Great Lakes region, and much of Ontario, with subfreezing weather approaching the Dakotas. A blanket of snow up to two feet deep covered much of the Northwest Territories, Nunavut, and the Hudson Bay region. This allowed for widespread radiational cooling, turning Canada into a polar air factory. While much of the U.S. enjoyed the reprieve from summer heat, wheat futures on the Minneapolis Grain Exchange hit their highest level in seven months as soggy, cold crop fields snarled the annual seeding of spring wheat.
While this is nothing unusual in winter, May finds hot tropical air in abundance in the subtropical latitudes. With such a strong contrast between the air masses, powerful weather systems are generated where the air masses meet. The webwork of isobars drawn on the map clearly shows a deep 985 mb low in northwest Ontario. Fronts associated with this low are also evident. By far the most prominent front is the one stretching from Lake Superior to Kansas. It shows a very strong wind shift and coincides with a sharp pressure trough. This front represents the leading edge of cold Canadian air. But what other fronts are there? Is a warm front present?
As mentioned in previous installments of Forecast Center, an excellent technique for beginners is to set up an imaginary car trip and sample the weather as we travel. A good place to start is deep within the warm sector, for example in Missouri where it's about 76 degrees with a south wind. Travelling to Illinois the temperatures cool off just slightly and winds remain out of the south. But once we reach Chicago, it's rainy with overcast skies and in the upper 60s. Moving further into Michigan, it's even cooler and just as dreary. A logical conclusion here is that we crossed a front just before reaching Chicago. And since the winds are out of the south, moving warm air poleward, it's safe to say that this is a warm front. Where this front meets the cold front, it forms an intersection known as a "triple point", demarcating the northernmost extent of warm tropical air, and that portion of the cold front extending northward is an occluded front.
In northern Quebec, the map shows a very strong temperature contrast, identifying an east-west front. This front divides modified polar air in the Great Lakes region and New England from bitterly cold polar air originating in northern Canada and Greenland. What type of front is it? The wind flow across the front is not clear, so a safe assumption is that it's stationary except in Hudson Bay where the cold air is wrapping into the low.
Some readers might connect this northern front directly to the surface low. There's nothing wrong with this, and nothing shown on the map argues against this. But it's important to consider the origin of the low. Deep low pressure areas found north of an active cold and warm front, such as the one shown in Ontario, are usually the result of an occlusion, which occurs when the cold sector wraps completely around the low and cuts it off from the warm sector. Indeed, the warm sector is nowhere near the Ontario low and is found in Illinois southward, showing that this occlusion process has already taken place. The occluded low, deprived of contact with the rich tropical air, normally fills and dies away over a period of several days. But in this case there's a good chance the occluded low will link up with the Hudson Bay front, feeding off the strong temperature contrasts. This process is called baroclinic development, and once it happens, a frontal system can begin anew. The forecast does not look good for northern Quebec!
Computers do not produce the puzzle solution. The weather chart is created automatically with Digital Atmosphere, but fronts and isobars are added by hand using Adobe Illustrator.

Click to enlarge
©2009 Taylor & Francis
All rights reserved