Forecast Center
September/October 2009
by TIM VASQUEZ / www.weathergraphics.com
|
This article is a courtesy copy placed on the author's website for educational purposes as permitted by written agreement with Taylor & Francis. It may not be distributed or reproduced without express written permission of Taylor & Francis. More recent installments of this article may be found at the link which follows. Publisher's Notice: This is a preprint of an article submitted for consideration in Weatherwise © 2009 Copyright Taylor & Francis. Weatherwise magazine is available online at: http://www.informaworld.com/openurl?genre=article&issn=0043-1672&volume=62&issue=5&spage=70. |
PART ONE: The Puzzle
Siberia is well-known in popular culture for its reputation as the icebox of the north. The coldest temperature in the northern hemisphere was recorded at Oymyakon, located in inland Siberia, which bottomed out at -90 deg F in February 1933. When summer arrives here, it brings warmth and an abundance of active weather systems. Analyzing fronts in this part of the world provides excellent practice for those who are accustomed to the predictable patterns often found in the United States and Canada. Fortunately, the fundamentals of meteorology don't change based on international borders and all the same rules outlined in past issues of Forecast Center still apply.
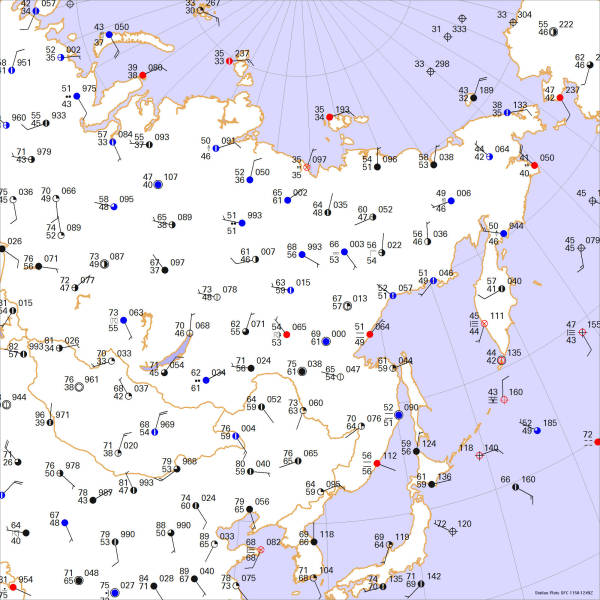
This weather map depicts a weather situation during the early evening in July. Draw isobars every four millibars (996, 1000, 1004 mb, etc) using the plot model example at the lower right as a guide. As the plot model indicates, the actual millibar value for plotted pressure (xxx) is 10xx.x mb when the number shown is below 500, and 9xx.x when it is more than 500. For instance, 027 represents 1002.7 mb and 892 represents 989.2 mb. Therefore, when one station reports 074 and a nearby one shows 086, the 1008 mb isobar will be found halfway between the stations. Then try to find the locations of fronts, highs, and lows.

Click to enlarge

* * * * *
Scroll down for the solution
* * * * *
PART TWO: The Solution
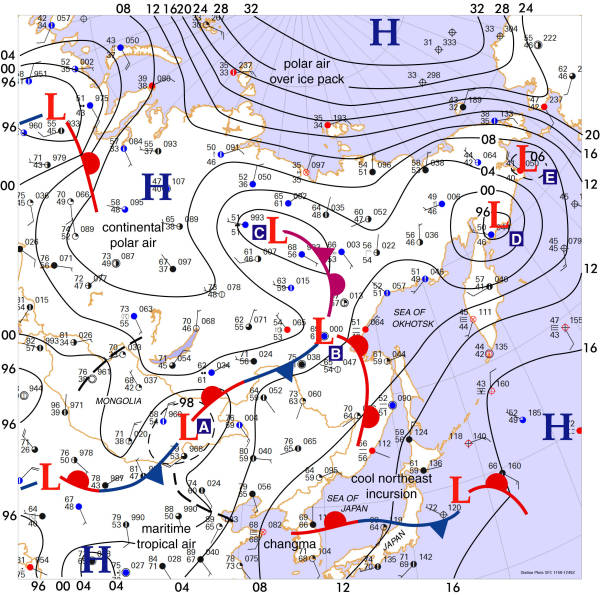
This issue's map shows the weather at about 9 pm local time on July 4, 2009. Temperatures range from the 30s in the arctic regions to the 70s and 80s in the temperate latitudes. Frontal systems are in between, and they are found by looking for strong temperature differences, pressure troughs, and wind shift zones. Even if your solution differs from the one presented here, it's no cause for concern as there's always some uncertainty in the diagnosis and every person's analysis will differ in the details.
The first question is what does the big picture show? The analysis shows a string of low pressure areas, troughs, and strong temperature contrasts extending from China well northward into Siberia. Another observation is the widespread cold air and high pressure over the Arctic Ocean. Daytime temperatures in the 30s are quite normal in July here due to poor solar heating on pack ice and cold ocean. Inland from the Arctic Ocean, solar heating on tundra and taiga allows temperatures in the 50s to predominate.
The low pressure systems in China and Mongolia are relatively easy to analyze, showing cyclonic flow and well-defined fronts. In China, systems like the one at (A) often emerge from the arid Gobi Desert regions bringing duststorms into the populated eastern regions. The map shows another system further north (B) that is affecting the Khabarovsk region. North from here, an occluded front was drawn in an area that was located in a trough but showed no significant temperature contrast. A low pressure area associated with this occlusion (C) was found near Yakutsk and is actually a decaying wave rather than a baroclinic (active frontal system). Days ago it was a frontal low pressure area that gradually occluded as the air around it homogenized and lost energy from the temperature contrasts, and it is destined to weaken and disappear in the eastern regions of Siberia.
No clear fronts could be found around the deep low pressure area near the northern Kamchatka Peninsula (D) so it too appears to be a decaying wave. Sharp analysts will have found second low pressure even further east near the town of Beringovsky (E) where very strong northerly winds are blowing. Buys Ballots law states that in the northern hemisphere, with one's back to the wind, low pressure area will be found to the left. This places a low pressure area just offshore. It has been drawn here with an intermediate dashed isobar to help show its position.
If the wind fields clearly show a cyclonic circulation, it's good practice to identify a low pressure area even if the isobars or pressure fields don't show anything. By doing this, a low pressure area in western China was diagnosed as well as another off the east coast of Japan. Doing this kind of detective work and finding details that are not readily apparent at first glance is one of the hallmarks of a sharp forecaster.
The Korean peninsula shows a feature known as the changma, or the east Asian monsoon. This feature is largely the result of shallow cold air from the Okhotsk Sea region that filters southwest through the Sea of Japan, forming a semipermanent frontal boundary in Korea during the early summer. The front oscillates back and forth from day to day, producing lift and generating widespread clouds, showers, and storms. This helps generate the bulk of Korea's annual rainfall and eventually retreats north in August.
Computers do not produce the puzzle solution. The weather chart is created automatically with Digital Atmosphere, but fronts and isobars are added by hand using Adobe Illustrator.

Click to enlarge
©2009 Taylor & Francis
All rights reserved