Forecast Center
March/April 2010
by TIM VASQUEZ / www.weathergraphics.com
|
This article is a courtesy copy placed on the author's website for educational purposes as permitted by written agreement with Taylor & Francis. It may not be distributed or reproduced without express written permission of Taylor & Francis. More recent installments of this article may be found at the link which follows. Publisher's Notice: This is a preprint of an article submitted for consideration in Weatherwise © 2010 Copyright Taylor & Francis. Weatherwise magazine is available online at: http://www.informaworld.com/openurl?genre=article&issn=0043-1672&volume=63&issue=2&spage=70. |
PART ONE: The Puzzle
Very cold weather and a Midwest snowstorm made headlines in the United States during the weeks of Christmas and New Year leading into 2010, but across the Atlantic Europe was especially hard-hit. Authorities recorded at least 200 deaths across the continent due to the severe conditions, and the insurance industry predicted the economic impact over the season could total over US$23 billion. This issue's map takes a look at the deep freeze during one of the more prominent days of this event.
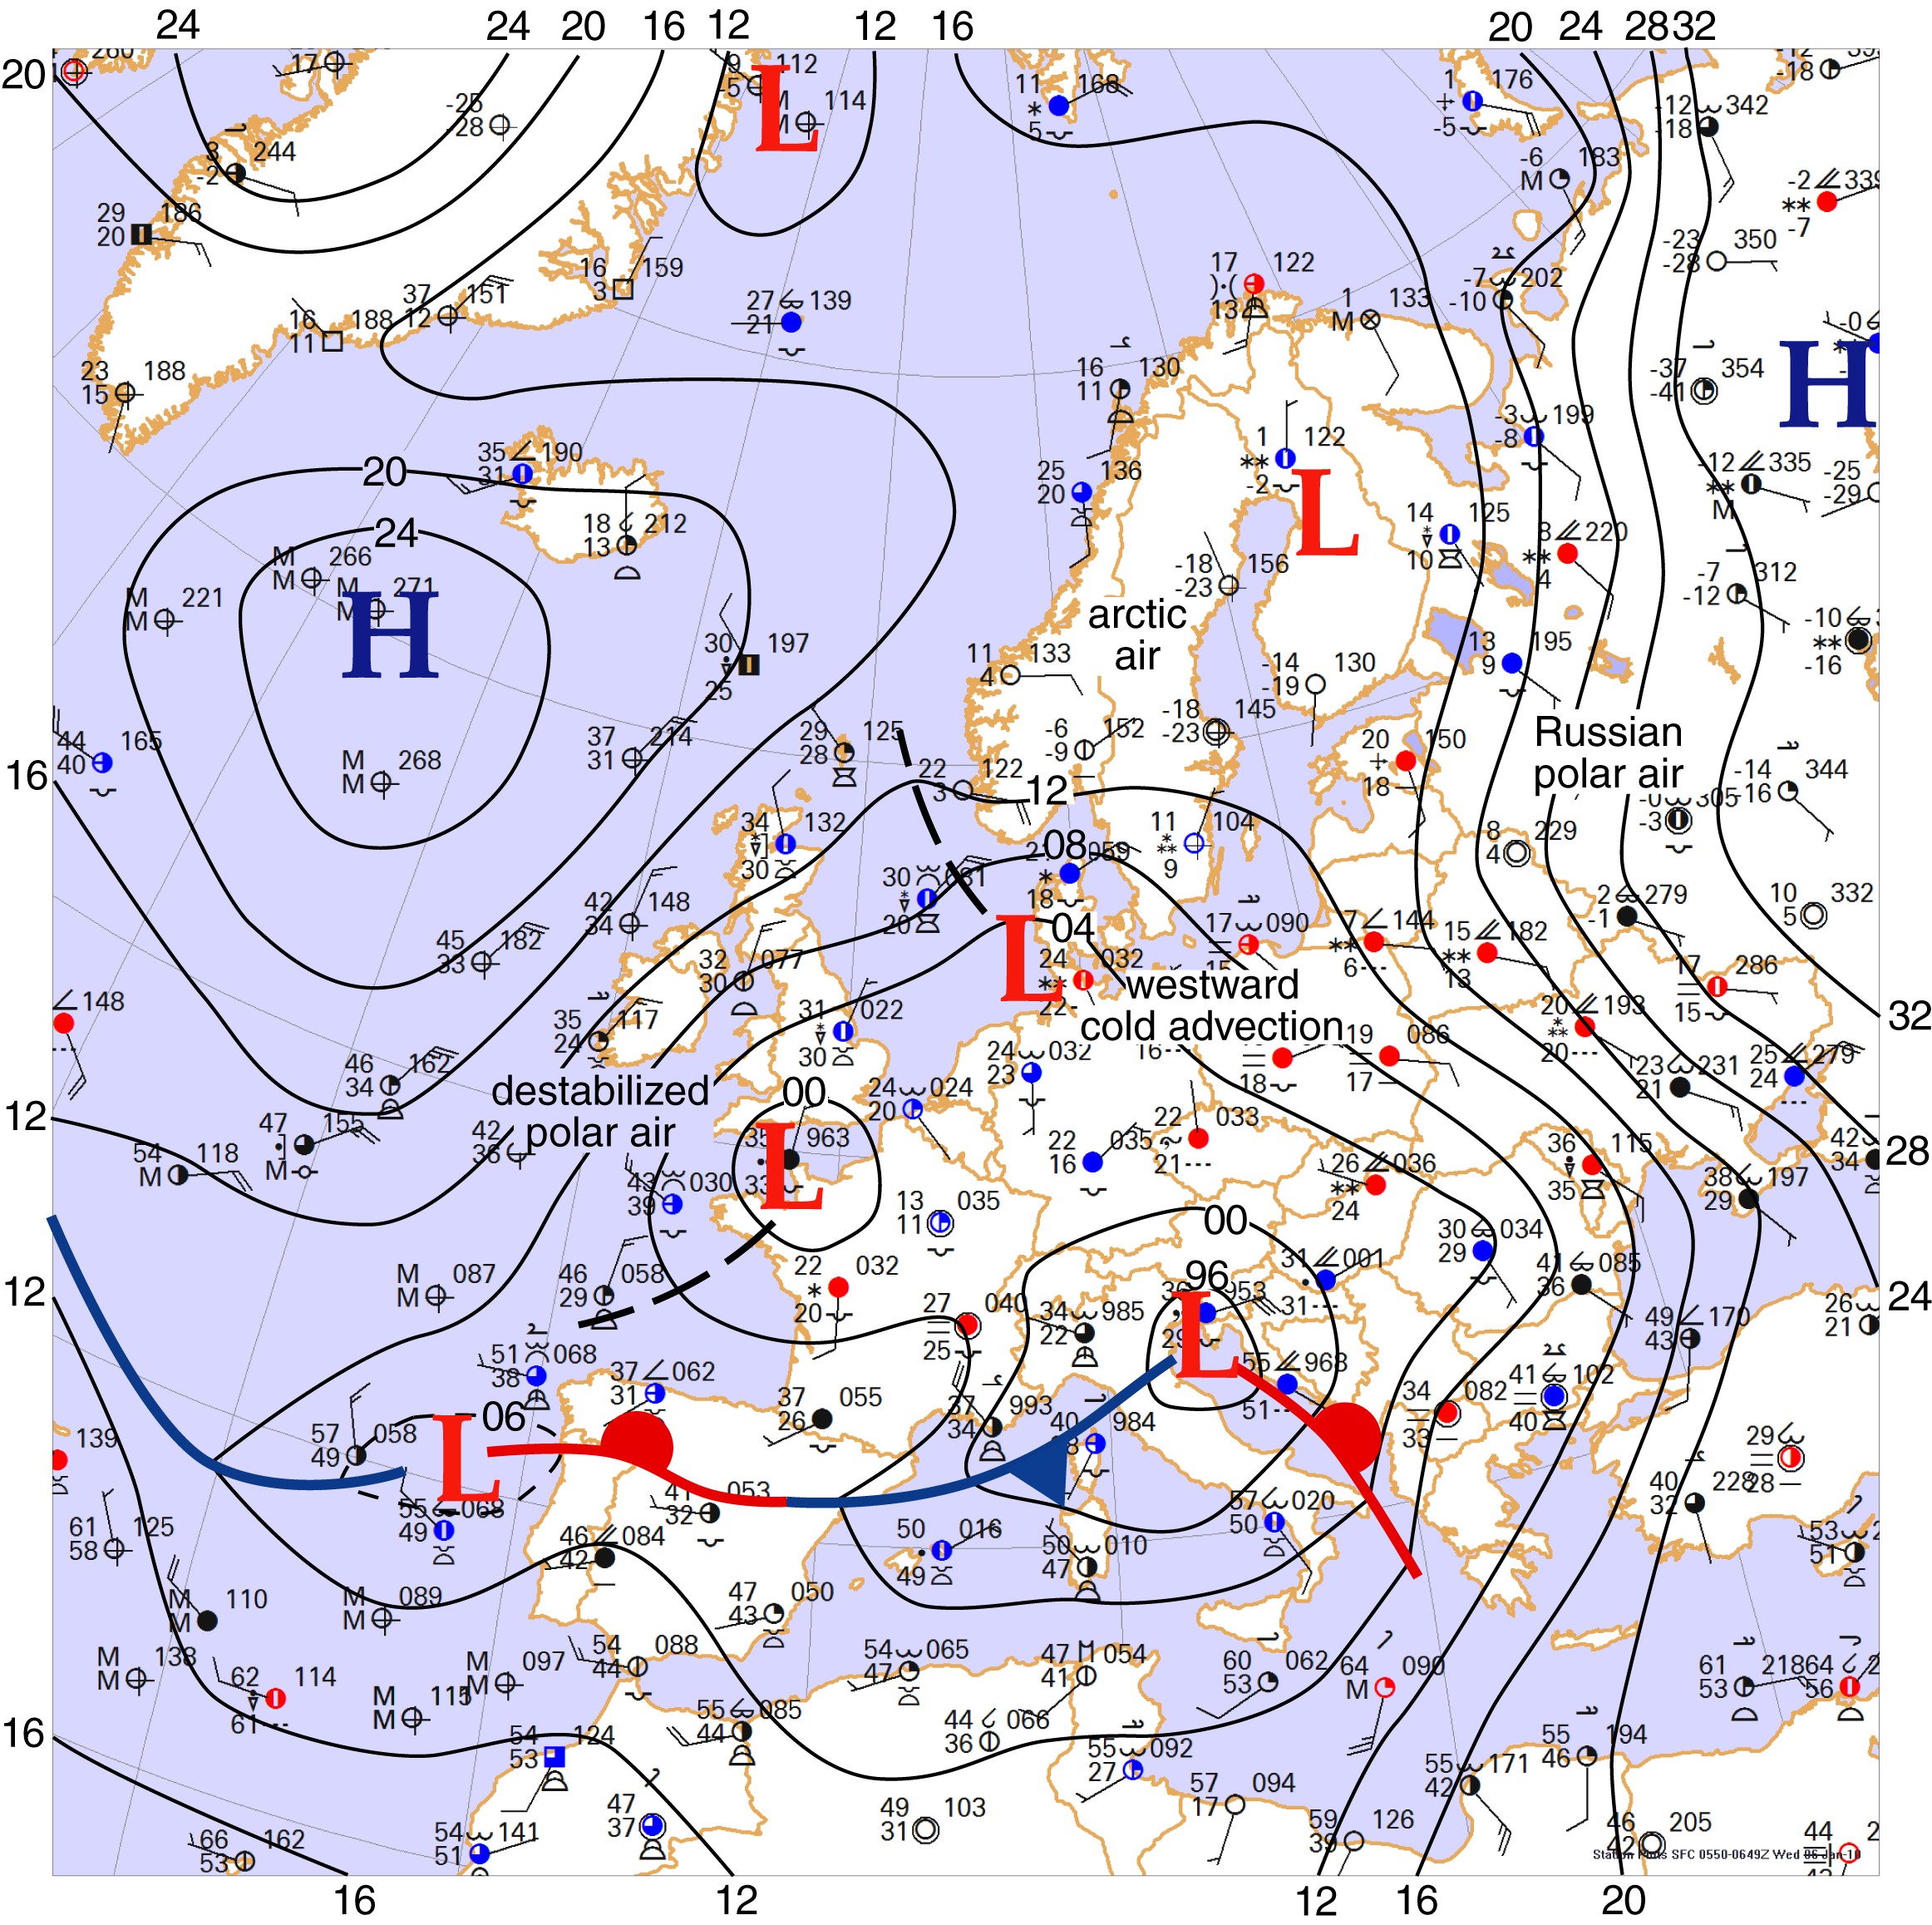
This weather map depicts an early morning weather situation in January. Draw isobars every four millibars (996, 1000, 1004 mb, etc) using the plot model example at the lower right as a guide. As the plot model indicates, the actual millibar value for plotted pressure (xxx) is 10xx.x mb when the number shown is below 500, and 9xx.x when it is more than 500. For instance, 027 represents 1002.7 mb and 892 represents 989.2 mb. Therefore, when one station reports 074 and a nearby one shows 086, the 1008 mb isobar will be found halfway between the stations. Then try to find the locations of fronts, highs, and lows.

Click to enlarge

* * * * *
Scroll down for the solution
* * * * *
PART TWO: The Solution
This map shows the morning hours of January 6, 2010 as a mass of cold air invaded Europe. Oslo, Norway remained below 0°F all day, and Stockholm Arlanda Airport dropped to -14°F, nearly 40 degrees below seasonal normals. By the next day, the cold weather intensified across central Europe and Great Britain, with Manchester Airport in England dropping to 5°F and remaining in the teens throughout the evening. On the 8th both Paris and Amsterdam fell to the single-digits by morning.
So how did it happen? Weatherwise, western Europe differs significantly from North America because it is not closely connected to any large arctic land mass or polar ice pack. This drastically limits the frequency of severe cold outbreaks. Furthermore it is usually in close contact with the eastern cusp of the Gulf Stream, which brings relatively warm ocean currents from the western Atlantic towards Great Britain. However, Russia is in close proximity to both the arctic ice pack and extensive northerly tundra. When cold air is manufactured in these polar latitudes and overspreads western Russia itself, and couples with deep westward currents of air, the air mass can work westward into western Europe, creating the most common scenario for extreme cold weather in those locations. And in some situations, northern Scandinavia and Lapland can serve as a breeding ground for very cold air.
However in this case, look at the large area of high pressure in the Atlantic Ocean. This is an unusual pattern in January. Normally the relatively warm ocean waters generate weather disturbances and deep low pressure areas, particularly in the region near Iceland, while high pressure usually covers much of Europe. In such a case, with low pressure over Iceland and high pressure over Europe, this favors a prevailing southwesterly wind in north and west Europe. But in this case, the configuration of highs and lows favors a prevailing northeasterly wind. It was this pattern, in conjunction with the production of cold arctic air in Scandinavia and advection of deep polar air from the polar icepack region and Barents Sea region, which brought frigid weather to western Europe.
As this cold weather moved westward and southward, the modification of the air mass, especially over the warmer North Sea region, added heat and moisture to the lower layers of the air mass, destabilizing it from the bottom up and producing extensive cloud layers and snow. By contrast, in the continental United States such effects are not as prominent with polar outbreaks since the dry land mass does not contribute moisture, though the Great Lakes can be a prolific source of both both heat and moisture early in the winter season.
The map shows strong northwesterly winds along the southern French coast. This is the mistral, a cold wind which occurs when interior regions of France are cold and air is channeled southward through mountainous terrain to the Mediterranean sea. Such an infusion of cold air across the relatively warmer waters favors the development of deep low pressure areas between Spain and Italy. The frontal low seen here west of Spain moved eastward and intensified into a very strong Mediterranean low which went on to affect Italy.
One noteworthy feature on the map is the use of internationally-standardized cloud symbols, which are located directly above and below the circle of many of the plots. These were quite common in nearly all United States reports as late as the 1990s, but have nearly disappeared since then due to the replacement of human weather observers with the ASOS automated observation network. The cloud symbols continue to be widely reported throughout the rest of the world, however, and they remain useful for gauging the character of the air mass and providing clues to the location of surface features.
Computers do not produce the puzzle solution. The weather chart is created automatically with Digital Atmosphere, but fronts and isobars are added by hand using Adobe Illustrator.
Click to enlarge
©2010 Taylor & Francis
All rights reserved