Forecast Center
September/October 2010
by TIM VASQUEZ / www.weathergraphics.com
|
This article is a courtesy copy placed on the author's website for educational purposes as permitted by written agreement with Taylor & Francis. It may not be distributed or reproduced without express written permission of Taylor & Francis. More recent installments of this article may be found at the link which follows. Publisher's Notice: This is a preprint of an article submitted for consideration in Weatherwise © 2010 Copyright Taylor & Francis. Weatherwise magazine is available online at: http://www.informaworld.com/openurl?genre=article&issn=0043-1672&volume=63&issue=5&spage=64. |
PART ONE: The Puzzle
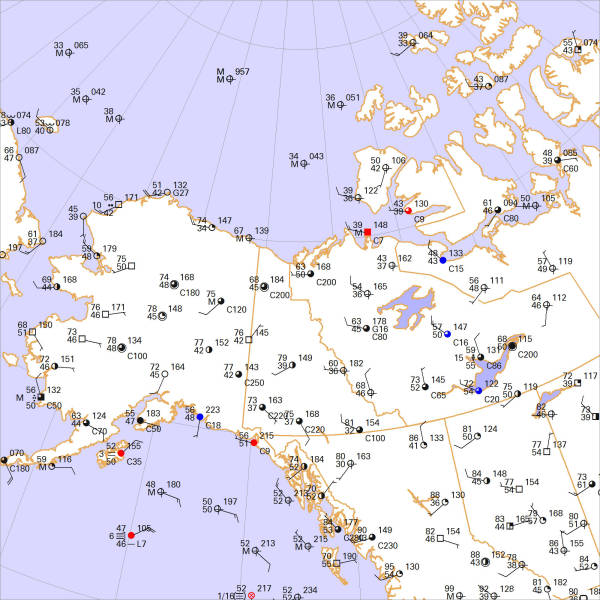
Almost any dedicated weather enthusiast knows that during the summertime, jet streams and weather systems retreat northward, leaving the United States under relatively quiet weather patterns dominated by features like the Bermuda High and the southwest desert low. But just what happens up north? For this issue, we head north to Alaska and the Yukon and look at the same weather charts used by Alaskan and Canadian forecasters.
In this issue we have added a special feature to the map: the ceiling in hundreds of feet above ground level. This is located in the lower right of each station plot following the letter "C". The ceiling is the lowest layer of cloud that covers more than half the sky. In the solution we'll discuss some of the ceilings shown and what the cloud layers mean to forecasters.

Click to enlarge

* * * * *
Scroll down for the solution
* * * * *
PART TWO: The Solution
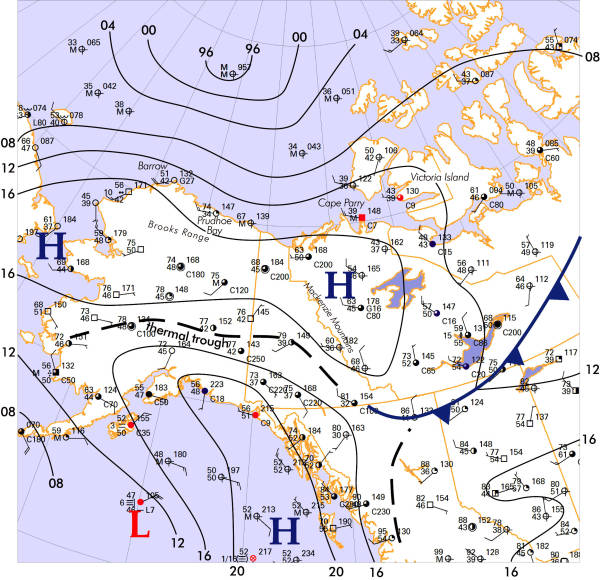
The patterns that unfolded on the afternoon of July 8, 2010 were actually a little unusual for the summertime. During the warm season, the continent is warm and the ocean waters are cool, meaning that the oceans are affected by large-scale high pressure while continental regions are dominated by low pressure. The unique geography of Alaska and the Yukon tends to cause this low pressure area to focus into a long, ribbonlike "thermal trough" extending from central Alaska into northwest Canada. But what we see in this map is unusual. Instead of broad low pressure in Alaska with a thermal trough, what we see is low pressure in the oceans and a large polar high covering Alaska and the Yukon, driving a front southwest through the Northwest Territories.
Ironically, this type of pattern is precisely what leads to record heat in northern Alaska! In a normal pattern, cool winds blow off the Arctic Ocean basin, keeping temperatures near 40 the northern coast. Instead, with high pressure in the interior, winds blow from the southwest, not only bringing a fetch of relatively warm continental air northward but causing adiabatic warming as winds blow over the top of the Brooks Range, an east-west chain of mountains that rise as high as 8500 ft. On this day, southwesterly winds caused temperatures to soar to 74 degrees at the Prudhoe Bay oil fields, over twenty degrees above normal. A similar effect occurs on the Mackenzie Mountains which borders eastern Yukon, bringing record high temperatures to the Northwest Territories.
Even with a weak polar air mass across Alaska, the thermal trough maintains its definition, and can be seen here stretching from central Yukon into southwest Alaska. The thermal trough does not have frontal characteristics, but it represents a zone where winds tend to converge. This makes it a focus for afternoon showers and thunderstorms, giving the interior region most of its annual precipitation. This activity is benign, however, with severe weather and tornadoes remaining extremely rare. The thermal trough follows the axis of strongest solar heating and coincides with areas experiencing warm temperatures.
Ceiling heights are often omitted in weather analysis, but they are important to forecasters. The area near Victoria Island and Cape Parry shows ceilings of around 800 feet, which indicates stratus and implies high humidity in the lowest levels of the atmosphere and the presence of an frontal or radiational inversion. Further east we find ceilings of 6000 to 8000 ft, indicating high stratocumulus and altocumulus and suggests layers of significant moisture aloft. Given sufficient lift, this can evolve into fields of precipitation. Central Alaska shows ceilings of 12,000 to 20,000 ft, which is likely comprised of altocumulus and cirrus and is probably the result of elevated moisture "debris" from showers and thunderstorms.
Though arctic weather remains a curiosity for many weather enthusiasts, this region is becoming increasingly important to meteorologists. Given the trends in arctic pack ice coverage, the development of Canadian naval bases in the arctic, the increase in trans-polar airline routes, and the rise of petroleum exploration in the Arctic basin, the subject of arctic meteorology promises to grow in importance over the coming decade.
Computers do not produce the puzzle solution. The weather chart is created automatically with Digital Atmosphere, but fronts and isobars are added by hand using Adobe Illustrator.

Click to enlarge
©2010 Taylor & Francis
All rights reserved