Forecast Center
January/February 2011
by TIM VASQUEZ / www.weathergraphics.com
|
This article is a courtesy copy placed on the author's website for educational purposes as permitted by written agreement with Taylor & Francis. It may not be distributed or reproduced without express written permission of Taylor & Francis. More recent installments of this article may be found at the link which follows. Publisher's Notice: This is a preprint of an article submitted for consideration in Weatherwise © 2011 Copyright Taylor & Francis. Weatherwise magazine is available online at: http://www.informaworld.com/openurl?genre=article&issn=0043-1672&volume=64&issue=1&spage=99. |
PART ONE: The Puzzle
During the winter season, three key storm tracks affect the United States: a southeastward storm track from Canada, an eastward track from the Pacific, and a northeastward track from the Gulf of Mexico. In this issue we'll take a look at the Pacific track, comprising the single most important weathermaker west of the Mississippi River. In spite of their meteorological and economic importance, these systems can be quite difficult to follow because of their interaction with the high, rugged terrain of the western United States. Try your hand at finding such a system in this puzzle, and on the solution page we'll present some expert tips for a better understanding of how they work.
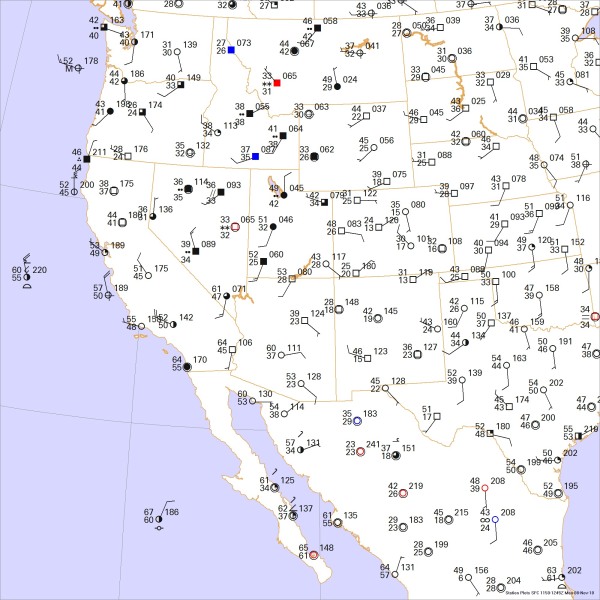
This weather map depicts a morning situation in November. Draw isobars every four millibars (996, 1000, 1004 mb, etc) using the plot model example at the lower right as a guide. As the plot model indicates, the actual millibar value for plotted pressure (xxx) is 10xx.x mb when the number shown is below 500, and 9xx.x when it is more than 500. For instance, 027 represents 1002.7 mb and 892 represents 989.2 mb. Therefore, when one station reports 074 and a nearby one shows 086, the 1008 mb isobar will be found halfway between the stations. Then try to find the locations of fronts, highs, and lows.

Click to enlarge

* * * * *
Scroll down for the solution
* * * * *
PART TWO: The Solution
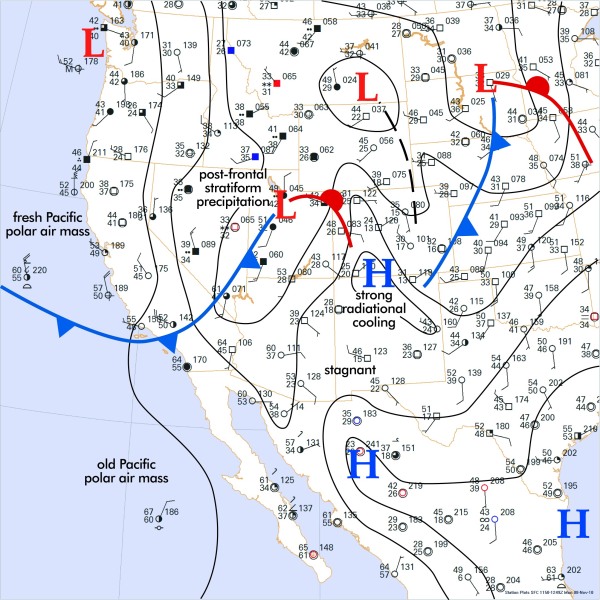
A Pacific system was moving inland on the morning of November 8, 2010, bringing showers and gusty winds to Nevada and California. The isobaric analysis showed a distinct area of low pressure across the northern Rockies and the Dakotas. This leaves the question of where to draw the fronts.
But rather than find the fronts, the next step is to understand the air masses at play. For example, in Arizona we see light winds, clear skies, and slightly warm morning temperatures, indicating the presence of a warm air mass. Meanwhile central California shows gusty northwest winds -- the hallmark of a fresh incursion of maritime polar air. In between these zones, forecasters are certain to find a front. And here, an important rule of thumb published regularly in this column bears repeating: the front is always found on the warm side of a transition zone between warm and cold air.
Another clue for understanding the weather pattern is found in the precipitation fields. Over half of the stations in Nevada and Idaho are reporting some form of stratiform precipitation. Such widespread, non-showery precipitation is often associated with instances of "isentropic lift", where a transition zone between a warm and cold air mass in the lower levels of the troposphere tends to cause mid-level winds to have a vertical component of motion. If this mid-level air has high relative humidity, layers of stratocumulus, nimbostratus, and altostratus clouds quickly develop and large areas of light to moderate precipitation soon follow. It should be emphasized that isentropic lift, by its very nature, occurs over the cold air mass, so if you see large areas of stratiform precipitation and the weather patterns are indicative of a frontal system, it's wise to look in a southward direction (in the northern hemisphere) for evidence of that front. Showery precipitation, by contrast, is associated with convective instability and can occur along or on either side of a front. Weather map symbols for showery precipitation use a V-shaped triangle beneath the rain or snow symbol.
So all of this suggests that the cold front stretches from northern Utah to southern California. But looking out into the Pacific we see 60-degree temperatures across much of the ocean and northerly winds. Where do we draw the front now? One rule we have outlined in previous columns is to take an imaginary trip that bisects the front, keeping within the same type of terrain as much as possible. So starting in a boat off the coast of Baja California we see light northerly winds and 67 degrees, and as we move off the coast of San Francisco this falls to 60 degrees with strong northwest winds. Going a little further north to Portland, Oregon, it gets even colder with 52 degrees and westerly winds. The sharpest transition occurred just before arriving at the station with the 60-degree temperatures. So it's safe to say that the front is found somewhere off the coast between Los Angeles and San Francisco.
Looking further inland, we see high pressure and cool, dry conditions across the Mexican interior, suggestive of a stagnating air mass and strong radiational cooling at night. Further north is another Pacific system moving through the Dakotas. Here the cold front is very weak, and to make things even more challenging for forecasters, the cold air that follows the front moves downslope and warms adiabatically. As a result, we see very little temperature contrast, especially across South Dakota. However in western Nebraska enough nighttime radiational cooling due to light winds and a dry air mass, along with a wind shift, has made the front's location evident.
So what is the destiny of these weather systems? This depends on the upper-level patterns and the amount of available moisture. Strong Pacific systems are often associated with deep upper-level troughs, and these can create large fetches of southwest winds in advance of the weather system, leading to the "Pineapple Express" scenario proclaimed by television forecasters. The injection of rich moisture into Pacific systems not only amplifies the precipitation fields but intensifies latent heat release, deepening the system further. In turn, a deep cyclone is much more efficient at drawing in warm air from the tropics and cold air from Canada, and the result is a potent weather system with all types of weather: supercells along the warm front, August temperatures ahead of the cold front, dust storms behind the cold front, and blizzards northwest of the surface low.
In this case, however, the lack of overcast conditions in western Mexico is a clear sign that tropical moisture is not being tapped, the 1004 mb pressure center in Utah is not suggestive of a deep low, and no arctic air in Canada is poised to filter into the back side of the system. What we see here is a weak but very common type of Pacific frontal system. The marginal Gulf of Mexico moisture lingering in Texas provides the only chance for this system to make weather headlines in the days ahead before its inevitable march into the eastern United States.
Computers do not produce the puzzle solution. The weather chart is created automatically with Digital Atmosphere, but fronts and isobars are added by hand using Adobe Illustrator.

Click to enlarge
©2011 Taylor & Francis
All rights reserved