Forecast Center
March/April 2011
by TIM VASQUEZ / www.weathergraphics.com
|
This article is a courtesy copy placed on the author's website for educational purposes as permitted by written agreement with Taylor & Francis. It may not be distributed or reproduced without express written permission of Taylor & Francis. More recent installments of this article may be found at the link which follows. Publisher's Notice: This is a preprint of an article submitted for consideration in Weatherwise © 2011 Copyright Taylor & Francis. Weatherwise magazine is available online at: http://www.informaworld.com/openurl?genre=article&issn=0043-1672&volume=64&issue=2&spage=99. |
PART ONE: The Puzzle
The winter season brings a dramatic pattern shift to the United States. With temperature contrasts between land and sea increasing sharply, weather systems strengthen. This means that not only can there be incursions of tropical air northward, but with the cold season taking hold there can also be massive outbreaks of arctic air southward from the polar regions. This puzzle takes a look at one such event in 2011.
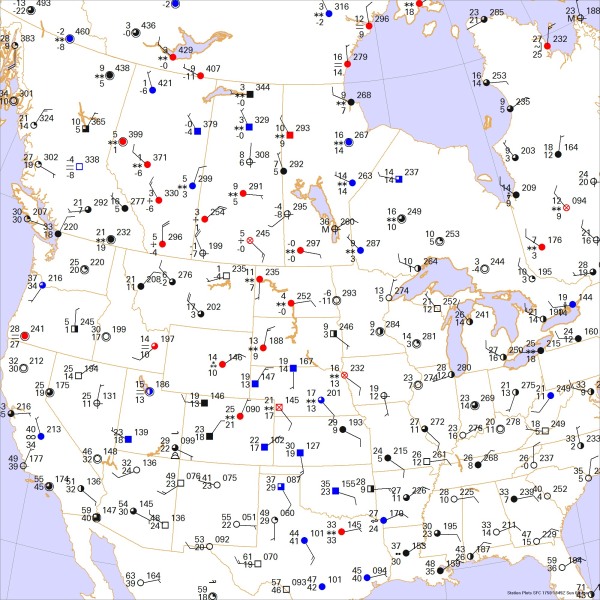
This weather map depicts a midday situation in January. Draw isobars every four millibars (996, 1000, 1004 mb, etc) using the plot model example at the lower right as a guide. As the plot model indicates, the actual millibar value for plotted pressure (xxx) is 10xx.x mb when the number shown is below 500, and 9xx.x when it is more than 500. For instance, 027 represents 1002.7 mb and 892 represents 989.2 mb. Therefore, when one station reports 074 and a nearby one shows 086, the 1008 mb isobar will be found halfway between the stations. Then try to find the locations of fronts, highs, and lows.

Click to enlarge

* * * * *
Scroll down for the solution
* * * * *
PART TWO: The Solution
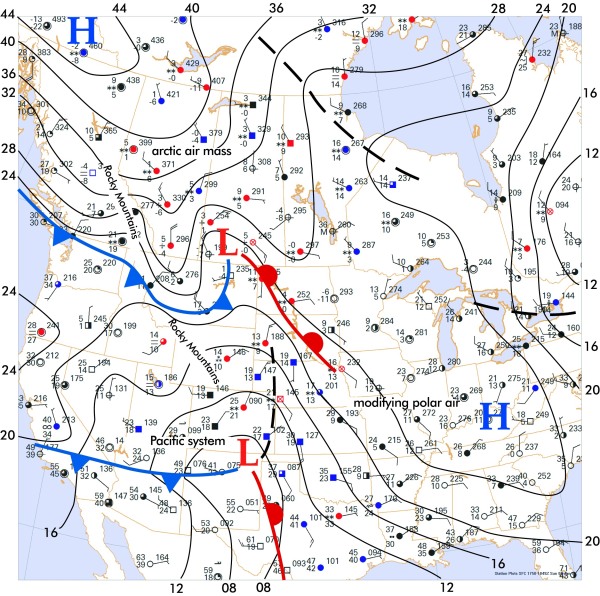
The map for January 9, 2011 showed many different patterns in place at the very same time. Without isobars and fronts as a guide, this might be perplexing to the beginning amateur meteorologist, but this can be easily understood by carefully going over the "big picture". First the isobars are drawn. This shows a large area of high pressure over the eastern United States, which seems to connect to a much stronger area of high pressure in western Canada.
How strong? This chart shows that the highest pressure in the cold air mass is at least 1049 mb. This value, equalling 31 inches of mercury, is usually associated with very strong cold air masses. The most intense arctic outbreaks in North America often show pressures of 1060 mb or higher, and those in Siberia may pass 1070 mb. Such air masses are so dense that an anecdotal rule of thumb held by longtime Great Plains forecasters is that once an arctic high in Canada or Alaska reaches 1060 mb, the chances approach 100% that the air mass will eventually overspread all of the United States east of the Rockies, regardless of whether it has upper-level support.
The temperatures in the eastern United States are typical of a cold January day. This and the high pressure area over the Appalachians suggests a recent outbreak of polar air which is still pushing southward but is stagnating, as indicated by the lackluster northerly winds in the Carolinas. Along the edge of the stronger high pressure area in Canada, a fetch of very strong northerly winds is shown in Alberta and Montana, signifying a fresh outbreak of polar air. This air still has many characteristics of its arctic source region, with bitterly cold temperatures and very dry dewpoints, so in addition to being a polar air mass it may also be referred to as an arctic air mass. These arctic air masses are dense, and like a pool of water they are usually dammed on their western periphery by the Rocky Mountains. Only very strong or very deep polar air masses, like the one seen here, are able to breach the mountain chain.
Careful analysts will have found an area of low pressure along the leading edge of this arctic air in Saskatchewan. This is a "baroclinic low", a weather system which feeds off the large difference in temperatures across the front and is reinforced by patterns in the upper levels of the troposphere. When they occur along strong southeastward-moving polar fronts they are called "Alberta clippers" (see Weatherwise, November 2009) and they bring clouds and snow as they move east or southeast. Very little moisture is associated with Alberta clippers, but since they are associated with very high snow-to-liquid ratios, they can cause surprisingly deep, powdery snow in only a short amount of time, which is then whipped up by the gusty northwest winds along the leading edge of the arctic air, leading to widespread blowing snow. The station plots in Saskatchewan containing weather symbols resembling crossed arrows indicates blowing or drifting snow.
But the big low pressure system concerning most meteorologists is found in New Mexico. This is along the southwestern edge of the old polar air mass, an area which usually remains strongly connected to the polar front jet and has access to warm, moist air with more potential energy. Given enough upper-level support, these lows can develop into major storm systems as they cross the southern states and move into the Atlantic region. The great March 13, 1993 superstorm is a classic example of such a weather system. Indeed, this weather system proceeded eastward and strengthened, bringing ice and snow from Dallas to Atlanta northeastward through Washington and New York City.
Computers do not produce the puzzle solution. The weather chart is created automatically with Digital Atmosphere, but fronts and isobars are added by hand using Adobe Illustrator.

Click to enlarge
©2011 Taylor & Francis
All rights reserved