This program has a lot to offer and will have even more in the near future. First off a little about myself. I work at KAMC-TV in Lubbock Texas. I have been the weekend meteorologist there since Nov of 2003. Before that, I went to School at Mississippi State University
and it was there when I was first introduced to Digital Atmosphere
(DAWS)! I didn't think much of the program until I came to Lubbock and
this is why!
I needed a program that could produce weather images every hour using
METAR data. Not only that, I need software which was windows base that
could do everything on its own. Then I found DAWS (Digital Atmosphere
Workstation). I bought the Professional version because it was only 110
bucks more and I get all the updates for free. Incase one of my hard
drives fail or a computer, I can easily put the professional version on
another computer! So I put the software to the test because I own and
operate:
 This webpage is one of the best webpage’s for a FORECASTER. You can easily go to The Weather Channel or The National Weather Service and find a forecast. But if you want to make your own forecast, then this is the site you want!
First off I wrote a few scripts which looks like this:
This webpage is one of the best webpage’s for a FORECASTER. You can easily go to The Weather Channel or The National Weather Service and find a forecast. But if you want to make your own forecast, then this is the site you want!
First off I wrote a few scripts which looks like this:
analyze,OVER
FILL COLOR=166:66:255 GRTN=15 OVER FILL COLOR=186:66:255 GRTN=14 OVER
FILL COLOR=206:66:255 GRTN=13 OVER FILL COLOR=226:66:255 GRTN=12 OVER
FILL COLOR=246:66:255 GRTN=11 OVER FILL COLOR=255:66:255 GRTN=10 degf
dwpt
Looks weird huh? But everything is explained in the manual so once you
read it, you would know this would produce a FILL CONTOUR of DEWPOINT
in F! I will show you an example below soon.
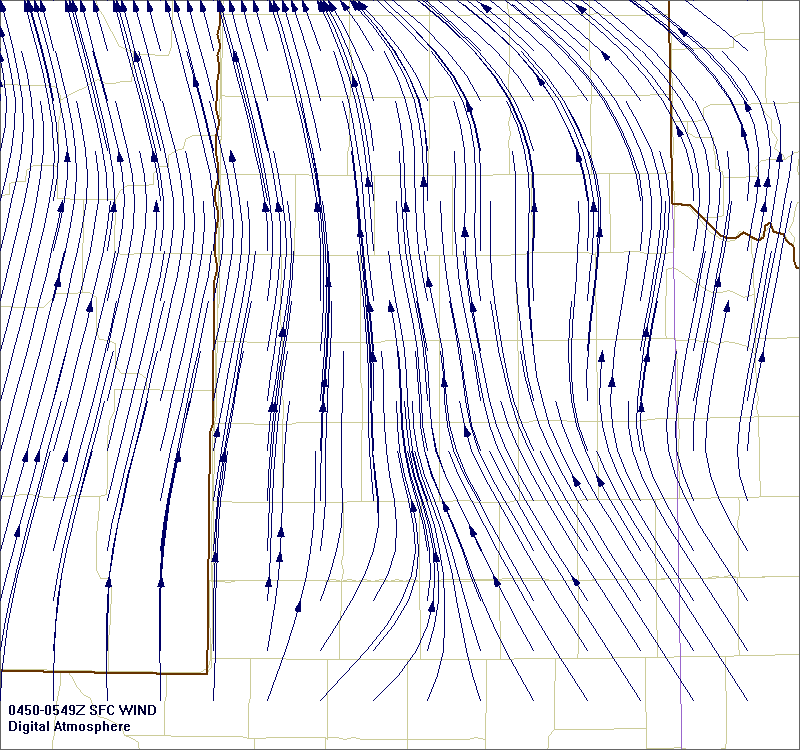
One of the first images I made and produced with DAWS was local images
that will help me forecast for Dry lines. Here are some OLD images that
I used to run every 15 mins on my computer for work:
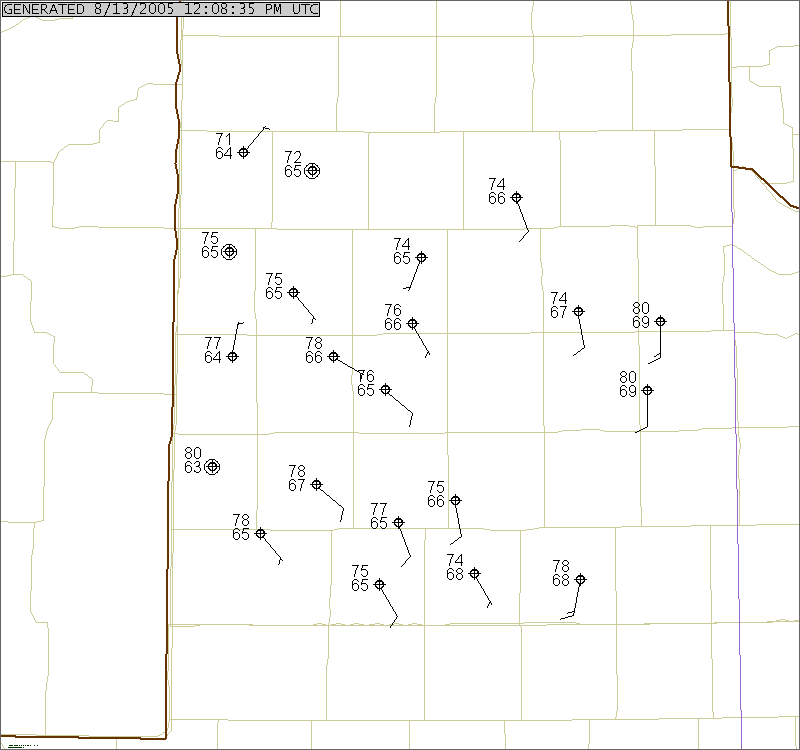
West Texas Mesonet Site data.
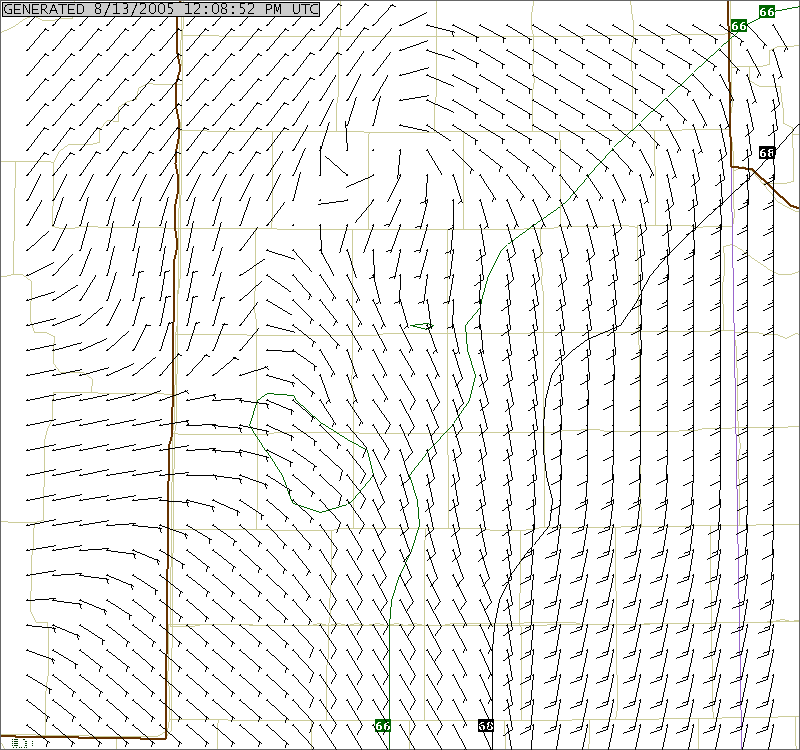
Dew point line contour with wind vectors
Streamline winds
Surface Wind with Lined Temp contours
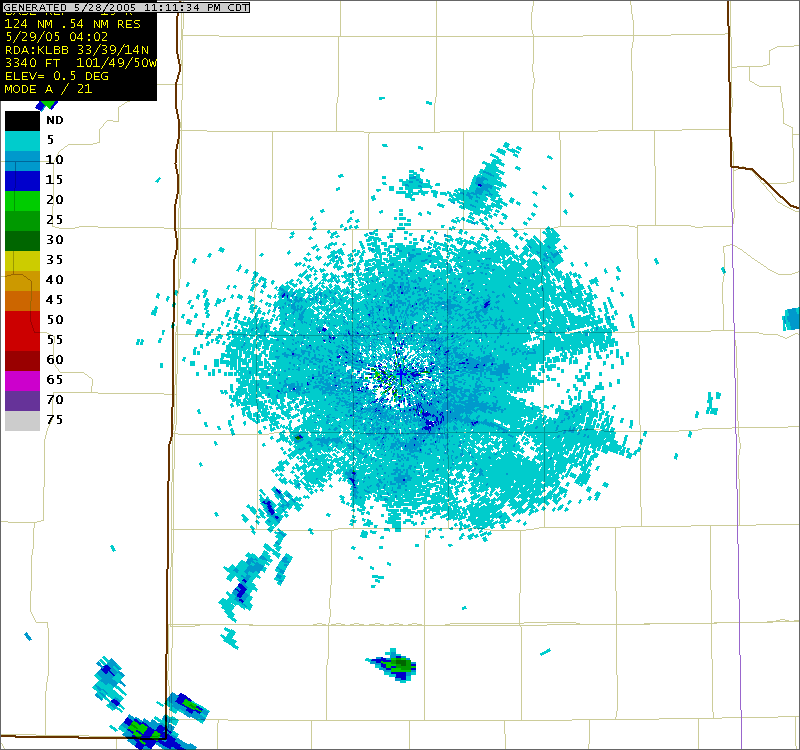
LBB Radar
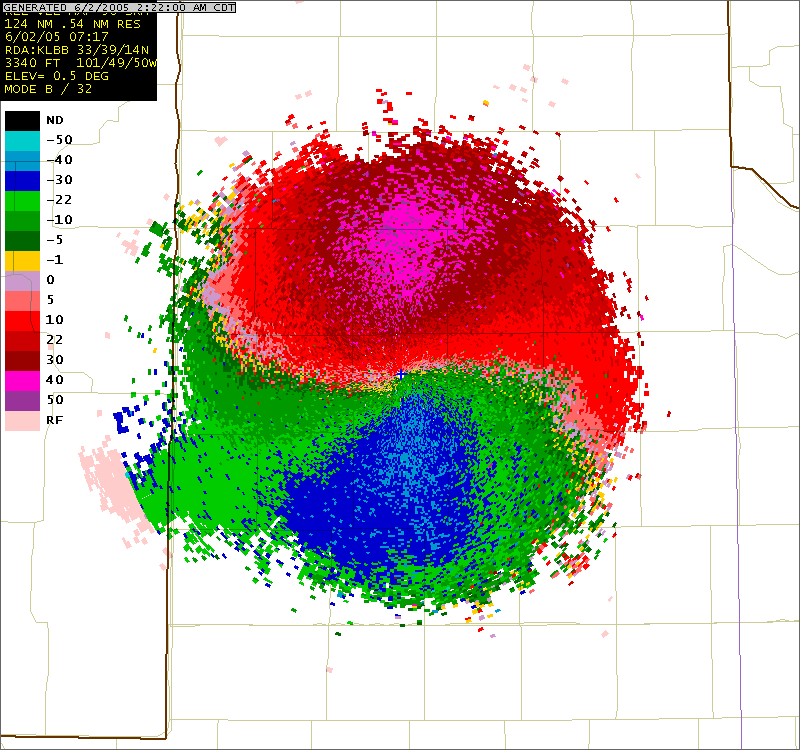
LBB Radar with SRV
So those where some older images that I no longer produce but can be
easily reproduced because the scripts are already written! That is one
of the best things, once you have a script, there is pretty much no
more work to be done by the user! The computer will to it all for you!
Then Hurricane Katrina came around and I started to make some hurricane maps. These maps are available on my Hurricane page on WXFORECASTER.COM. They update during Hurricane season but let me show you some images that come out EVERY HOUR!
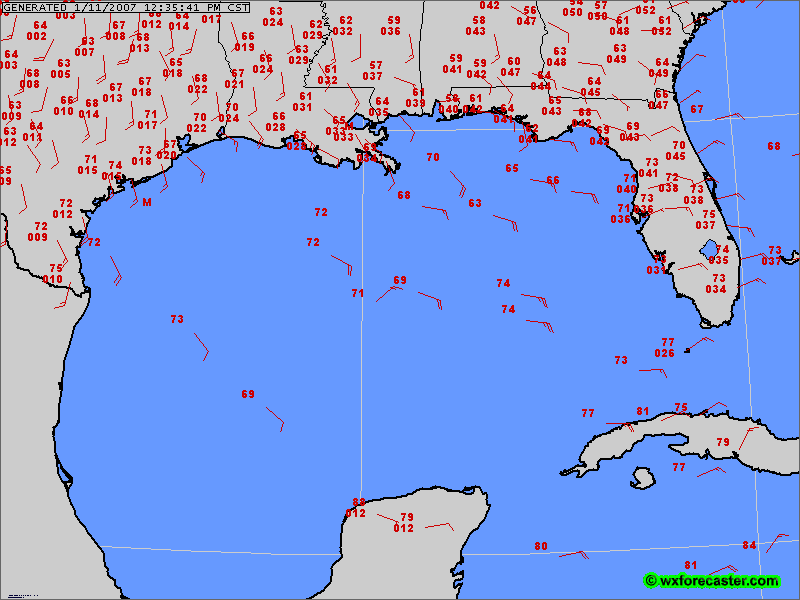
GOM Surface and Buoy obs
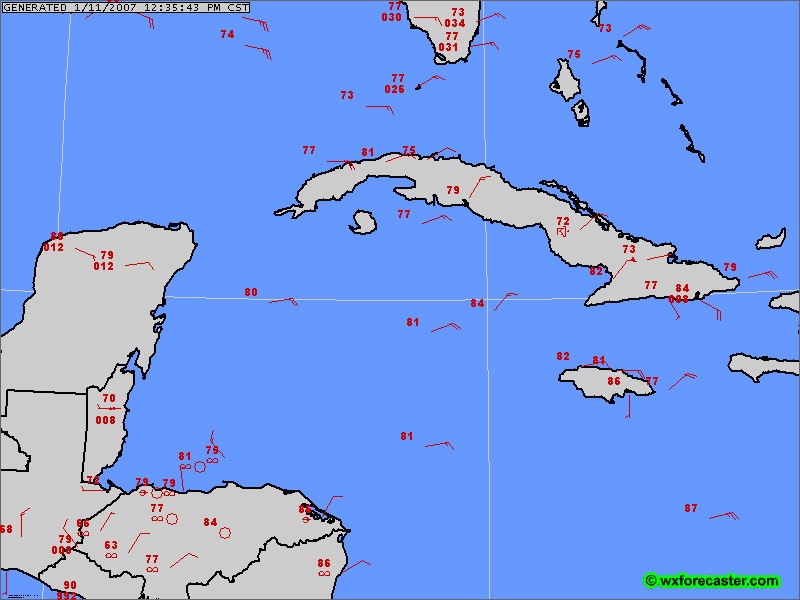
Caribbean Surface and Buoy Obs
I make images like this for FL, SE Coast, Mid-Atlantic, Eastern
Caribbean and South Atlantic. It looks really cool when there is a
hurricane. You can see the whole pattern.
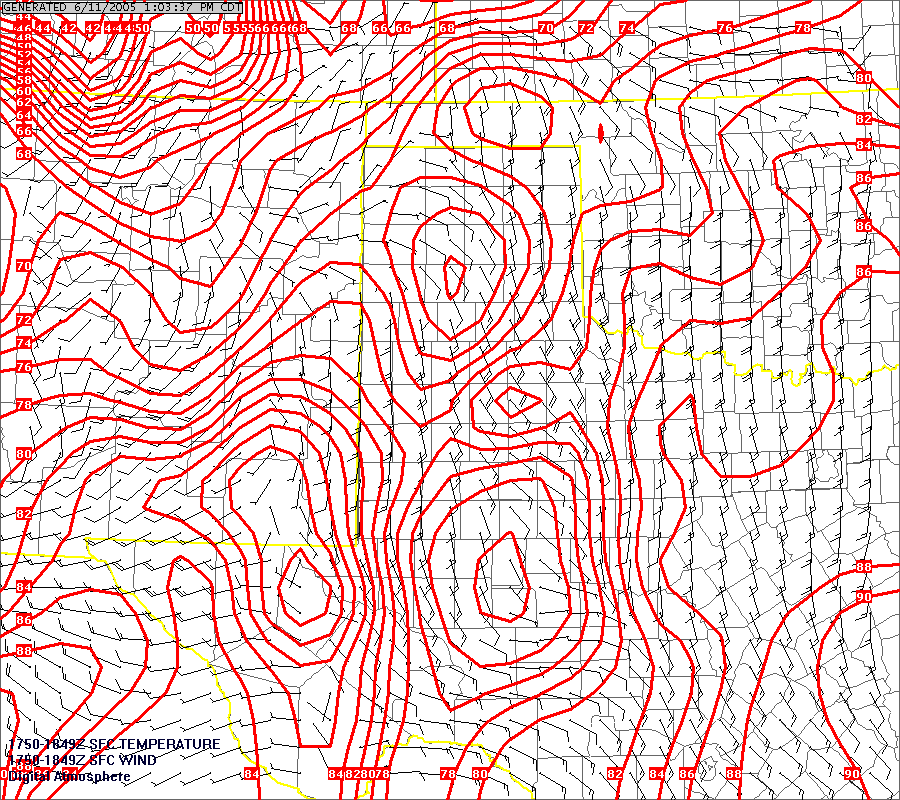
My Next project (also my current one) is to find a way to make images
graphically for the USA. So I made maps all over the country (14
regions). They are located on my Current Condition Page on WXFORECASTER.COM! Here are the images I make for the South Plains/Texas:
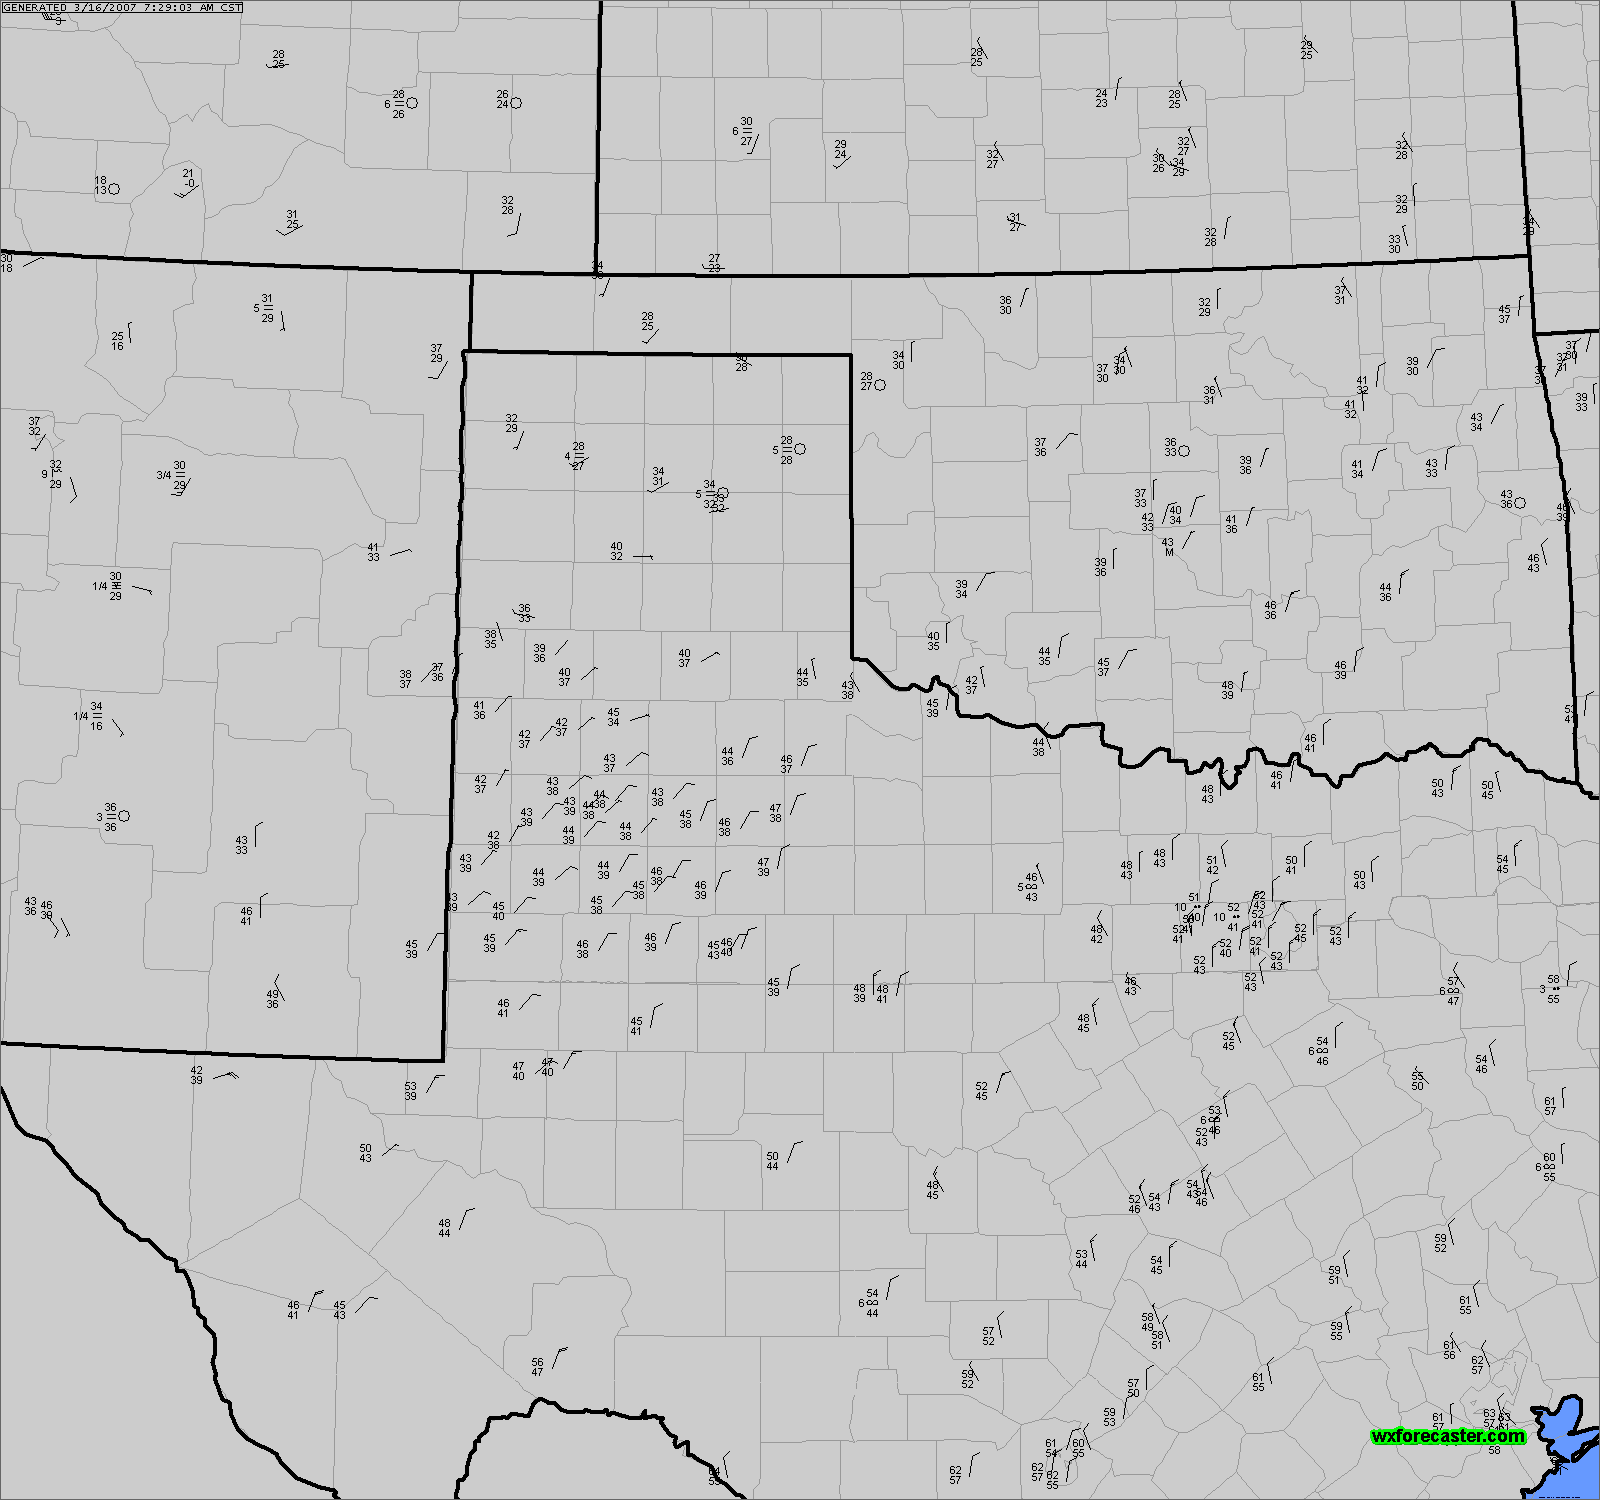
Surface Obs
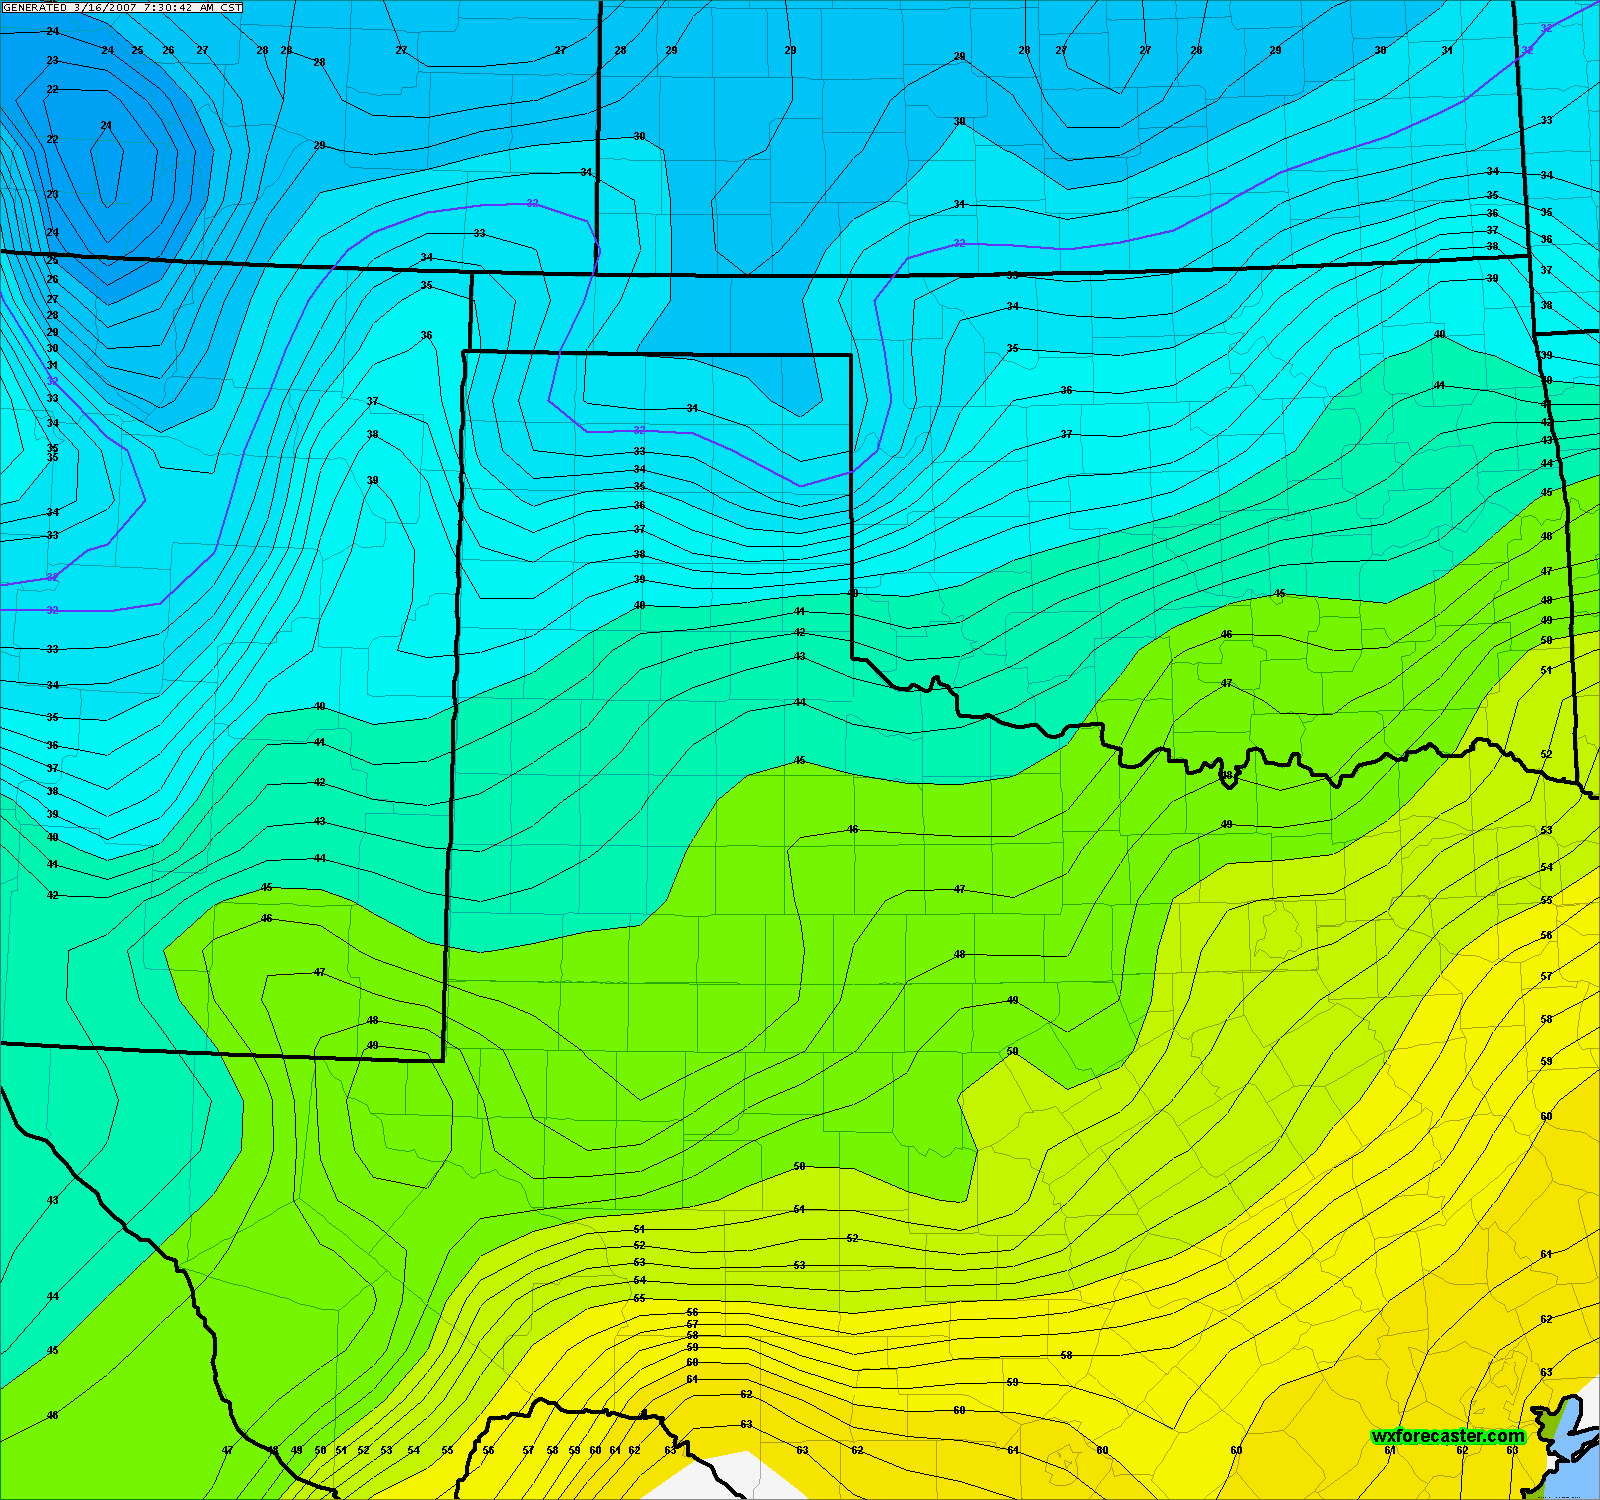
Temperature
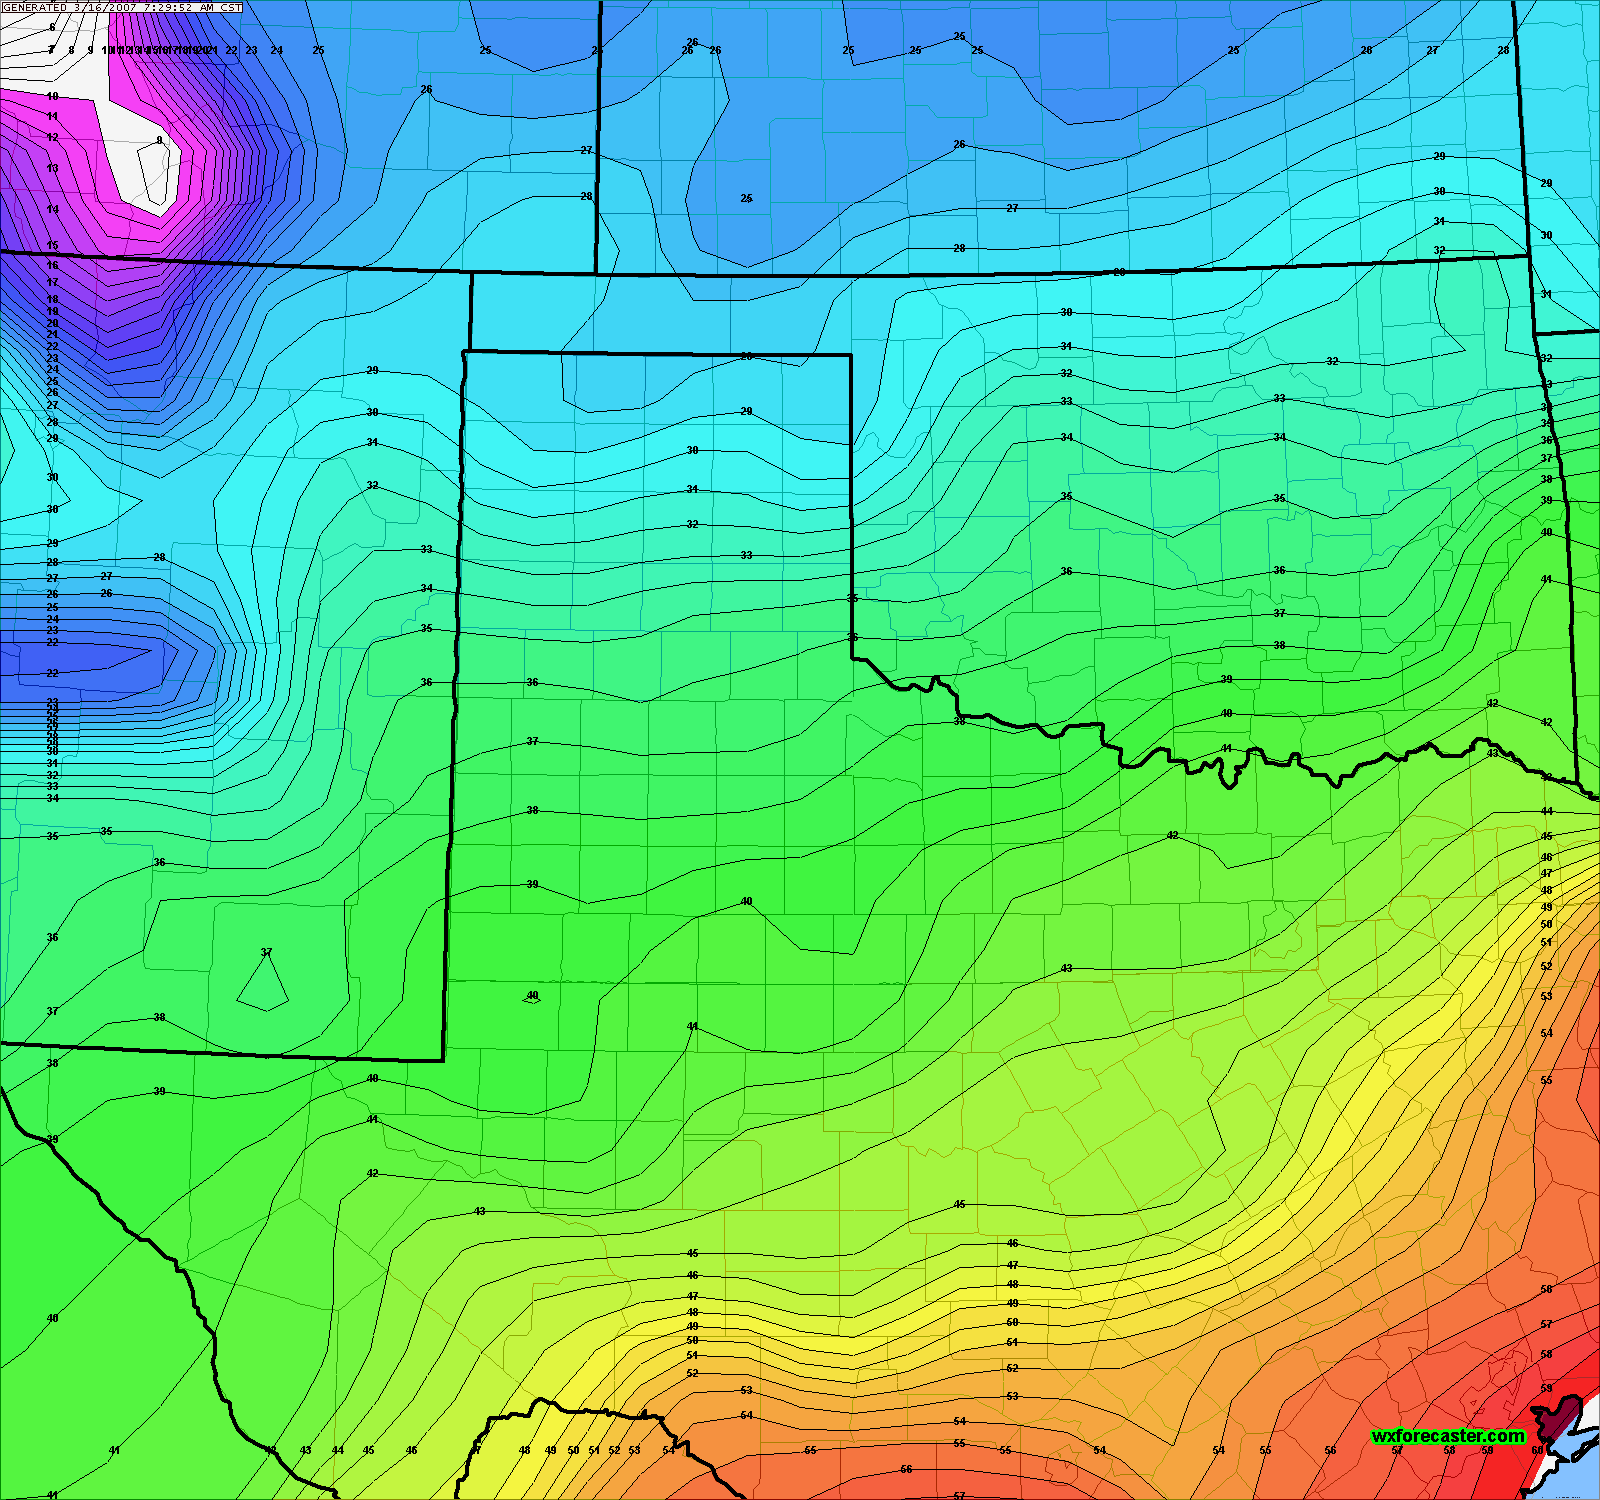
Dew point (will look really good during Dry line season)
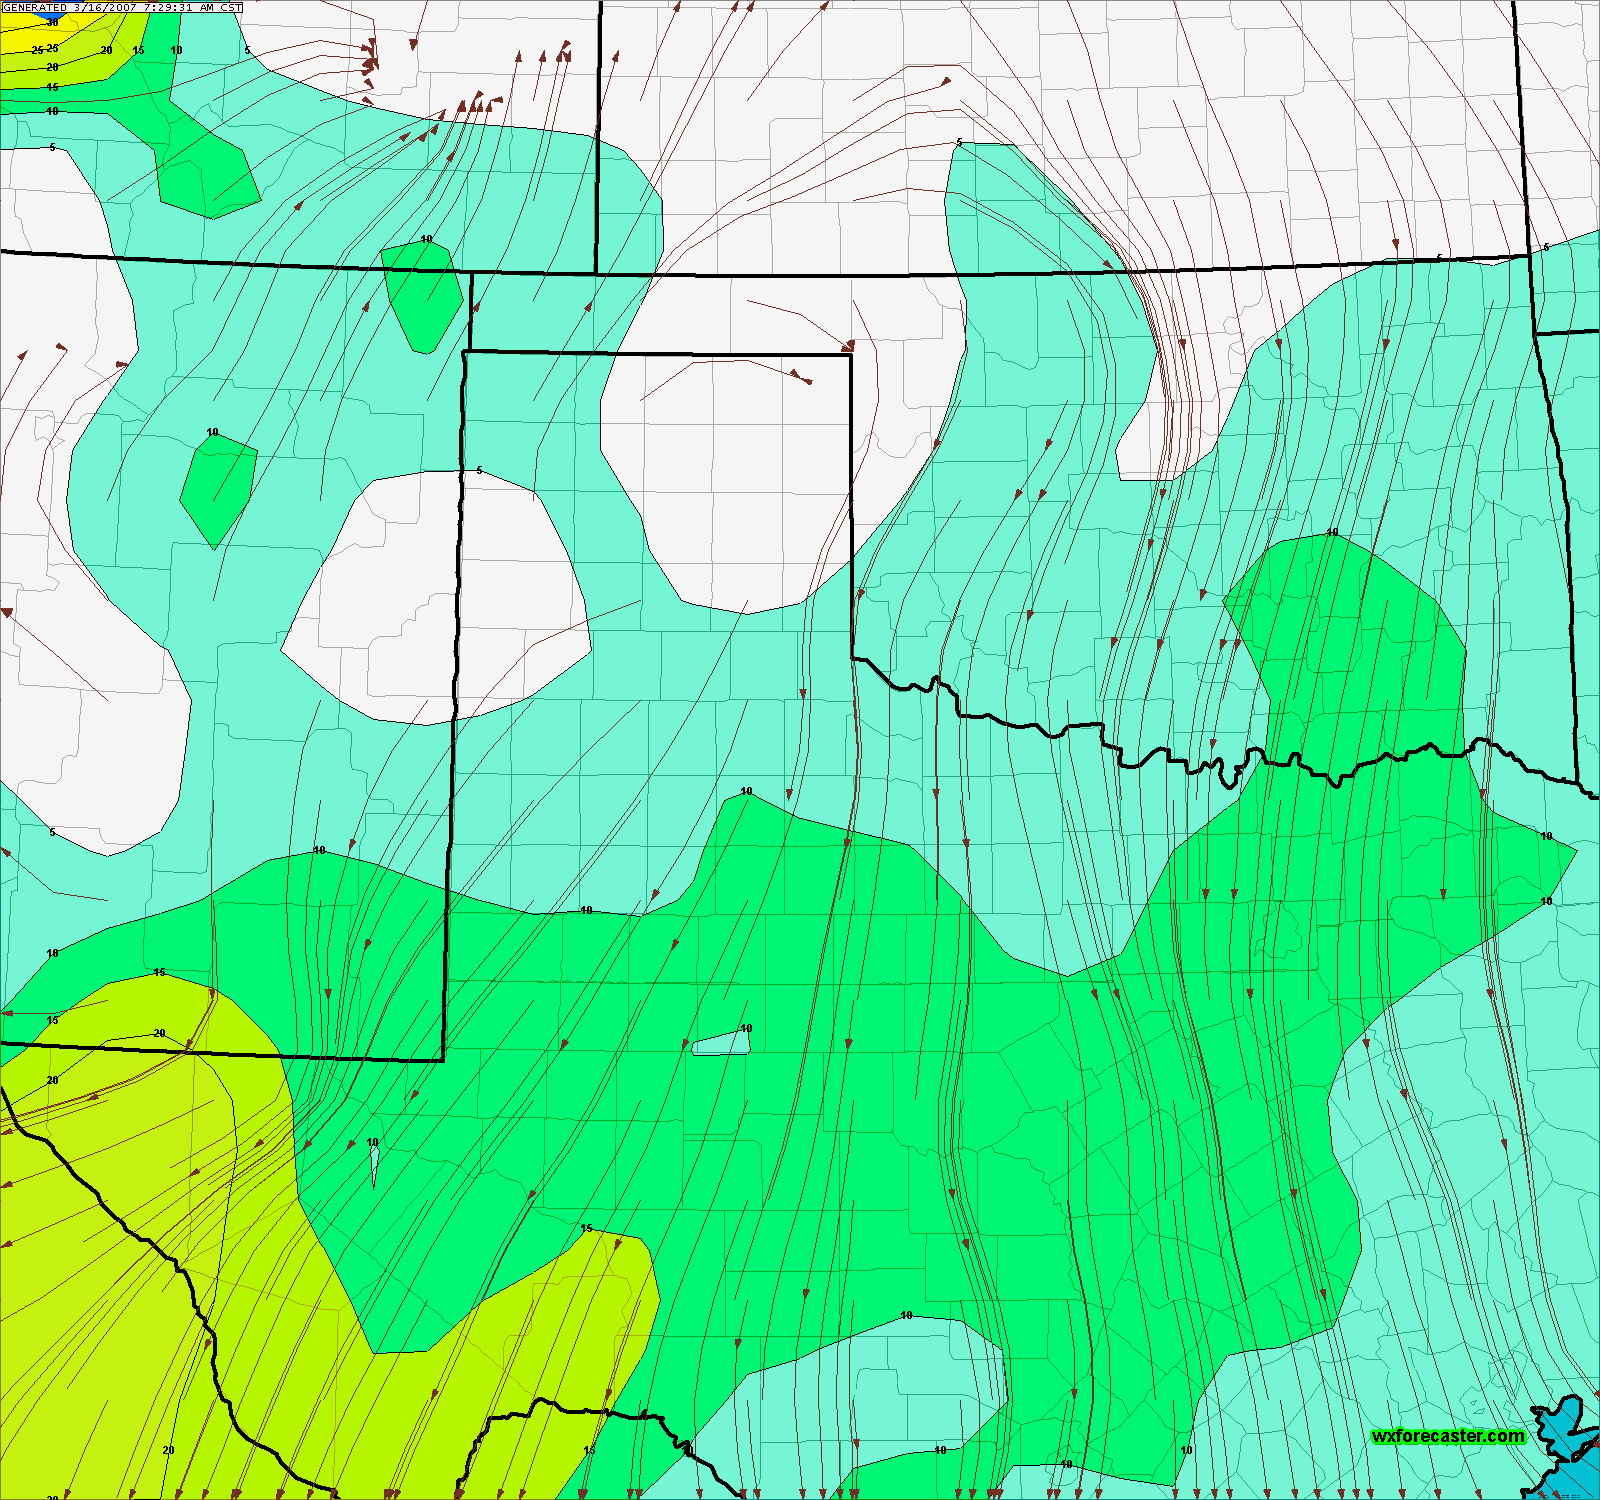
Wind Speed with Streamlines

Pressure

Pressure Tendency (only works every three hours)
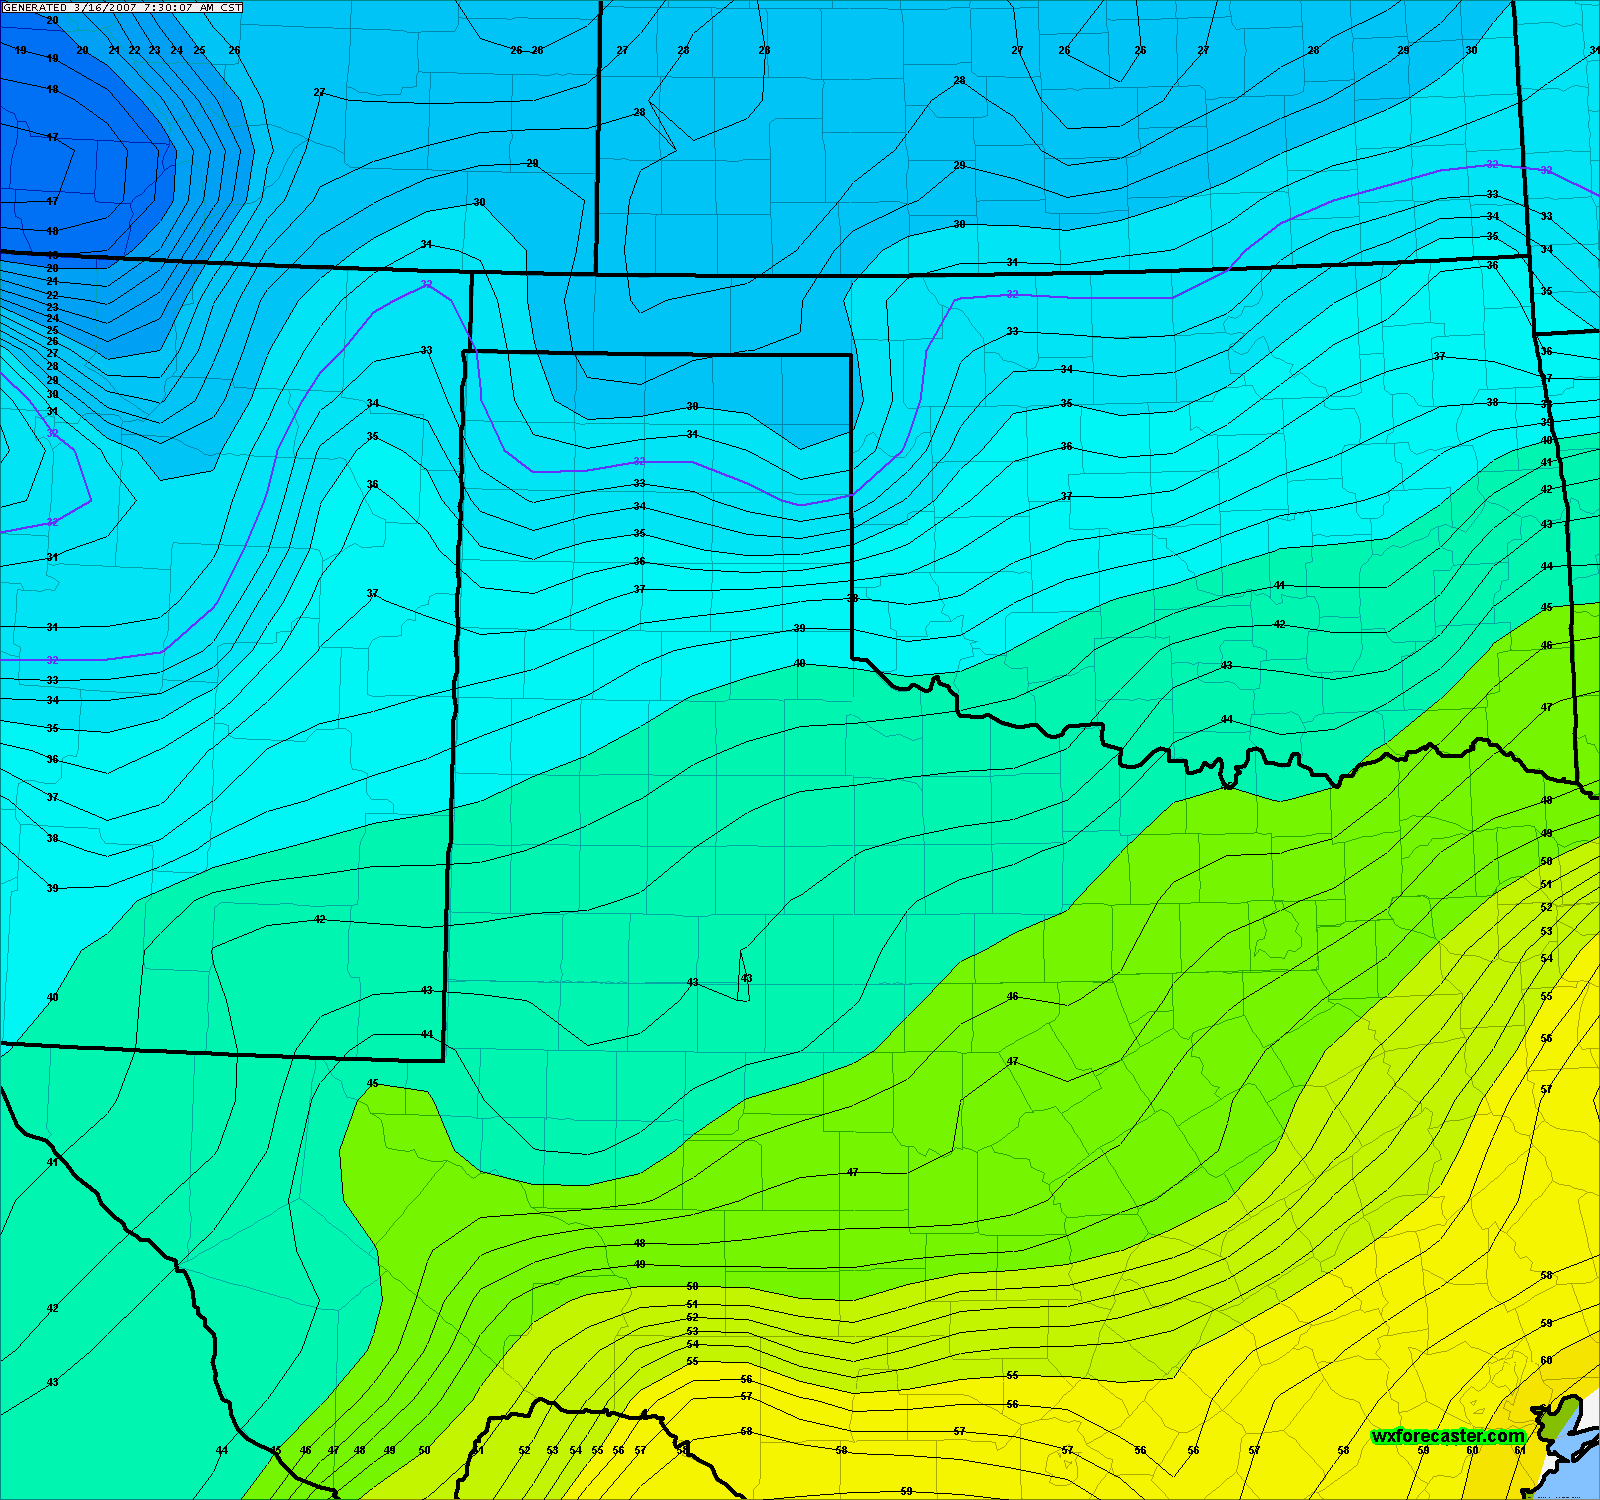
Wet Bulb Temp in F
Of course I make these Graphics every hour at 15 after. They upload to
my site around 30 after. It takes about 15 mins to make all the images.
I use an Intel Celeron CPU that is 1.4Ghz with 254 megs of RAM with
WIN2000!
There will be more images coming onboard with WXFORECASTER.COM.
Once GRIB scripting is available on Equinox, you will see RUC2 data
produced every hour on my webpage. I will have to upgrade my computer
but it will be worth it!