Forecast Center
May/June 2002
by TIM VASQUEZ / www.weathergraphics.com
|
This article is a courtesy copy placed on the author's website for educational purposes as permitted by written agreement with Taylor & Francis. It may not be distributed or reproduced without express written permission of Taylor & Francis. More recent installments of this article may be found at the link which follows. Publisher's Notice: This is a preprint of an article submitted for consideration in Weatherwise © 2002 Copyright Taylor & Francis. Weatherwise magazine is available online at: http://www.informaworld.com/openurl?genre=article&issn=0043-1672&volume=55&issue=3&spage=66. |
PART ONE: The Puzzle
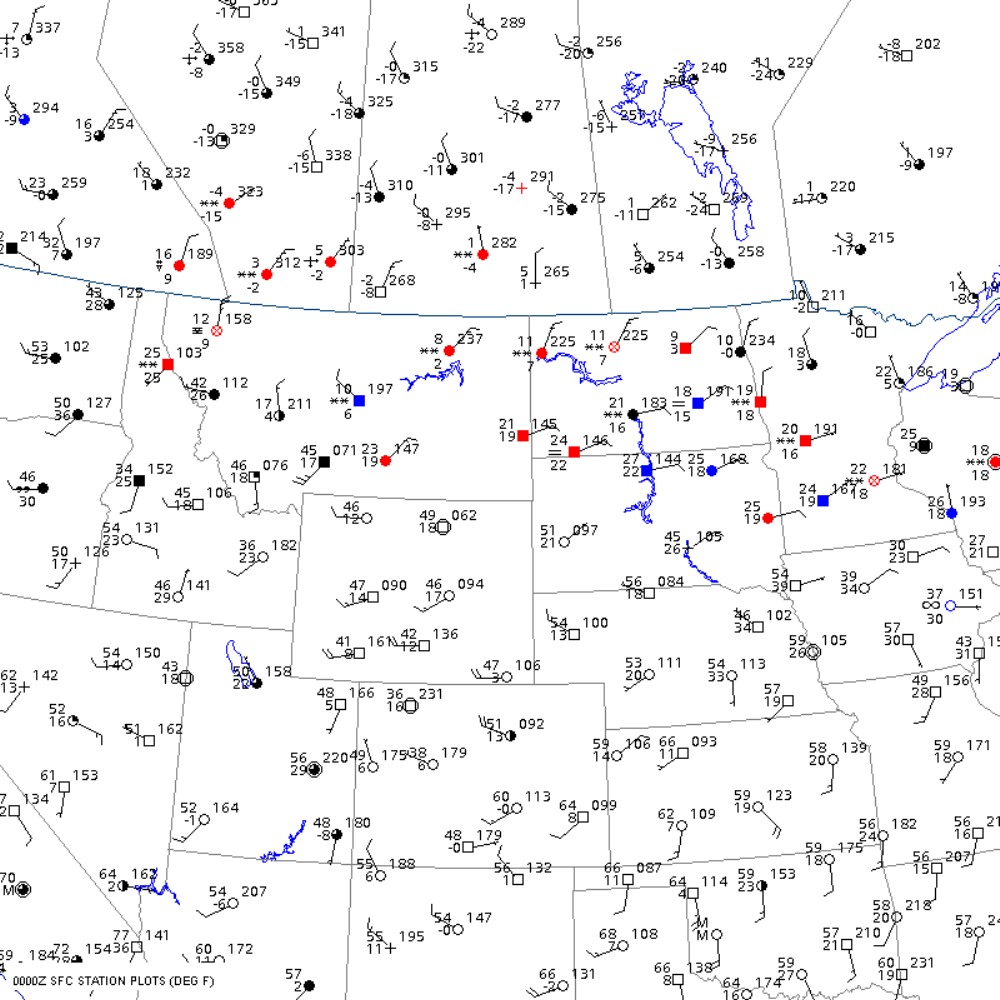
We usually don't turn our attention to frigid arctic air until it sweeps through our hometowns. However the weather charts can reveal many clues about the source and strength of cold air masses poised to move through the United States. Shown here is one such example. Can you locate the front and the arctic high?
Draw isobars every four millibars (992, 996, 1000, 1004, etc.) using the plot model example at the lower right as a guide. As the plot model indicates, the actual millibar value for plotted pressure (xxx) is 10xx.x mb when the number shown is below 500, and 9xx.x when it is more than 500. For instance, 027 represents 1002.7 mb and 892 represents 989.2 mb. Therefore, when one station reports 074 and a nearby one shows 086, the 1008 mb isobar will be found halfway between the stations.
Click to enlarge

* * * * *
Scroll down for the solution
* * * * *
PART TWO: The Solution
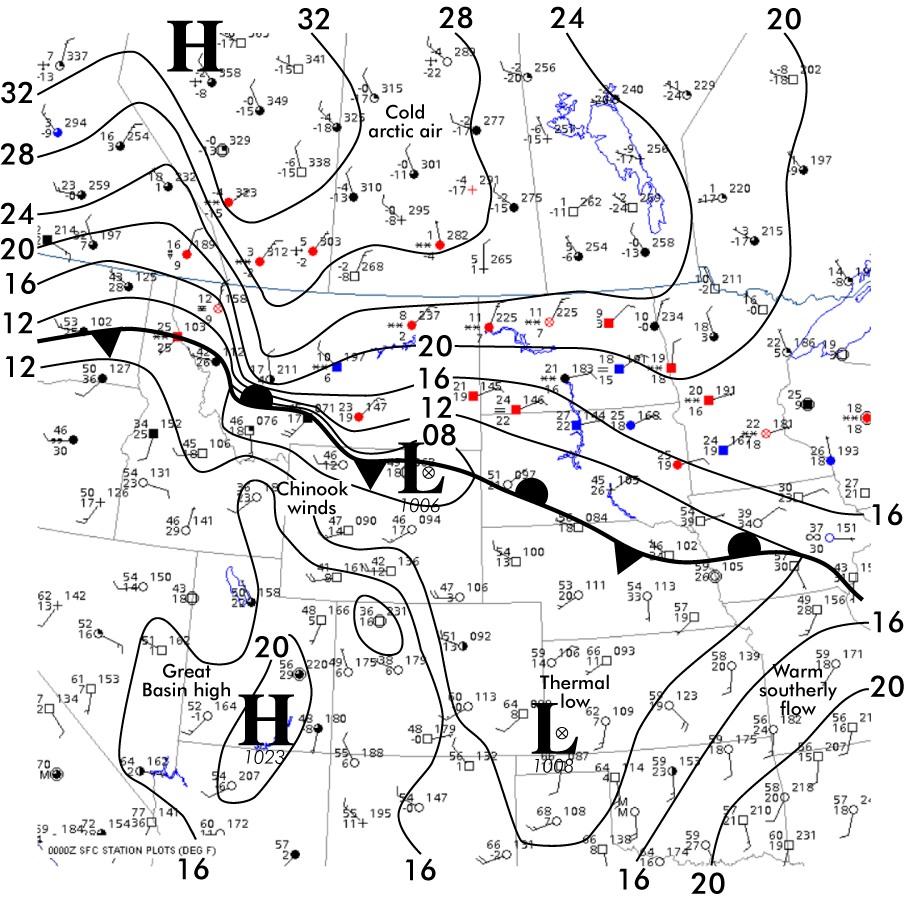
This issue's puzzle shows a fresh surge of arctic air on the afternoon of March 5, 2002. The air mass formed in the Yukon and Northwest Territories of Canada, and has sunk south into the United States. Contrasts in temperature readings and wind direction across the state of Montana are enormous. The arctic front is dammed solidly against the Rocky Mountains of western Montana, except for Washington and British Columbia where arctic air has seeped south from the Yukon through intermountain valleys.
Indeed this illustrates how arctic air is relatively dense and behaves like a heavy blob. While classic polar air can be as much as 10,000 feet deep, dense arctic air can be as little as 1,000 feet deep. This makes it impossible for weather balloons to sample them properly, and for computer models to resolve them. Therefore they always bring with them an element of unpredictability. Furthermore strong solar heating can erode the edges of the arctic air, slowing down an arctic front much faster than expected. Other times, the arctic air will sweep southward through its own sheer density, making the trip from Canada to the Gulf of Mexico in only 24 hours! Arctic air is a genuine challenge for even the most experienced forecaster, even more so since it usually brings the season's coldest outbreaks to much of the United States.
The surface map reveals warm chinook winds blowing through western Wyoming and the southwest edge of Montana. Chinook winds are common along the Rocky Mountains where strong westerly flow is in place. The air heats as it descends from the higher terrain of the Rocky Mountains, and can cause temperatures to rise to the 60s and 70s even in the middle of winter. Between chinook winds and arctic air, the northern plains can be a land of wild weather during the cold season!
Click to enlarge
©2002 Taylor & Francis
All rights reserved