Forecast Center
March/April 2004
by TIM VASQUEZ / www.weathergraphics.com
|
This article is a courtesy copy placed on the author's website for educational purposes as permitted by written agreement with Taylor & Francis. It may not be distributed or reproduced without express written permission of Taylor & Francis. More recent installments of this article may be found at the link which follows. Publisher's Notice: This is a preprint of an article submitted for consideration in Weatherwise © 2004 Copyright Taylor & Francis. Weatherwise magazine is available online at: http://www.informaworld.com/openurl?genre=article&issn=0043-1672&volume=57&issue=2&spage=98. |
PART ONE: The Puzzle
In the winter months, the ocean regions become stormy. The turbulent cyclones that breed over the open ocean are responsible for much of the weather affecting the western United States. In this puzzle we'll examine a typical January day across the eastern Pacific using observations from not only land stations but ships and buoys too. The sparsity of reports promise to make this issue's puzzle a challenge even for the most seasoned amateurs!
Draw isobars every four millibars (992, 996, 1000, 1004, etc.) using the plot model example at the lower right as a guide. As the plot model indicates, the actual millibar value for plotted pressure (xxx) is 10xx.x mb when the number shown is below 500, and 9xx.x when it is more than 500. For instance, 027 represents 1002.7 mb and 892 represents 989.2 mb. Therefore, when one station reports 074 and a nearby one shows 086, the 1008 mb isobar will be found halfway between the stations.
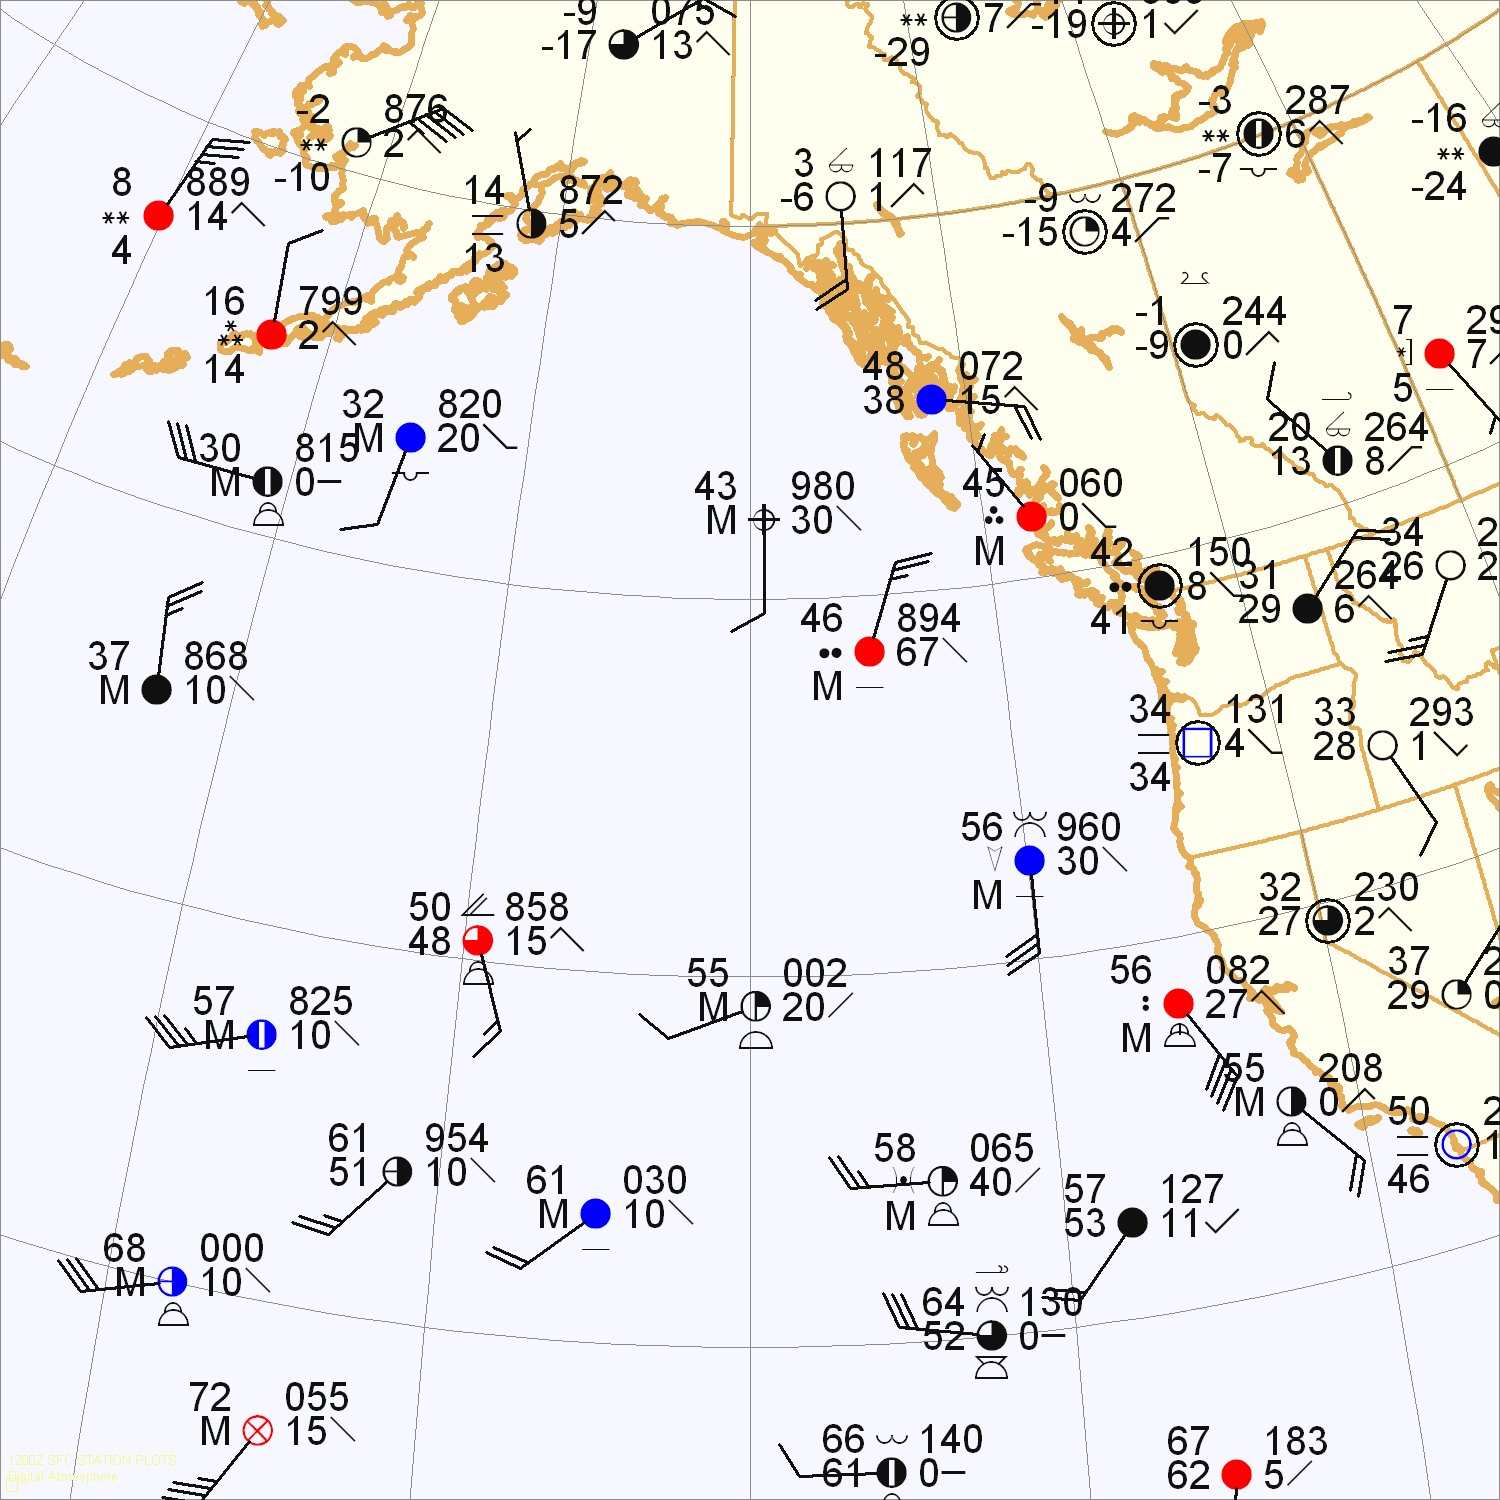
Click to enlarge

* * * * *
Scroll down for the solution
* * * * *
PART TWO: The Solution
The weather map for the morning of January 9, 2004 showed very low pressures over a huge swath of the Pacific. Across thousands of square miles of ocean, barometer readings were at or below 990 mb, or about 29.25 inches of mercury! The surprising fact is that this is not uncommon during the cool season.
Why are the pressures so low? During the winter months, the mean sun angle is lower and radiational cooling causes temperatures to fall across the continents. However the oceans act as a giant reservoir of heat, continuously conducting it into the air above. When a warm layer exists below a cold layer, it is thermodynamically unstable. Rising motion results, and much of the moisture in the air condenses, releasing latent heat and adding more warmth to the troposphere. Warm air is less dense than cold air, and because of this surface pressures on average are lower over the oceans during the winter. The continuous infusion of moisture and warm air, however, is the spark that creates not only low pressure but some of the most powerful weather systems on the planet.
These oceanic systems are important because they have a significant impact on day-to-day coastal weather. Weather forecasts for Vancouver, Seattle, Portland, and even San Francisco are at the mercy of what lurks offshore. America is heavily dependent on Pacific shipping lanes, which straddle the rough seas created by these systems. The strong upper-level wind profiles can cost airlines millions of dollars per month in wasted fuel if not adequately planned for.
For meteorologists, analyzing these weather systems is a tremendous challenge because of the limited amounts of data available. Valuable information comes from merchant ship observations and buoys, which are included in this puzzle, but many meteorologists in actual practice go much further and make use of satellite photos and other tools to perfect the surface analysis.
Accurately positioning surface features requires absolute use of the basic concepts of meteorology. For example, a low-pressure area cannot simply be drawn upon a station with the lowest pressure. If that station has a wind blowing from the north, Buys Ballot's law states that in the northern hemisphere low pressure will be to the east (and possibly to the southeast). Surface features must be adjusted accordingly. Stratiform clouds will usually indicate regions along and ahead of a warm front, while cumuliform clouds are associated with regions along and behind a cold front. Revisiting basic weather guides can be surprisingly helpful to a forecaster analyzing weather across an ocean.
To complicate things, thermal contrasts are not quite as sharp as those over land, due to the ocean's tendency to equalize temperature readings. This makes it challenging to find the location or even the existence of fronts. Wind shifts, pressure troughs, evidence in the station plots, and a working knowledge of conceptual frontal systems all become of added importance in helping the big picture to come together. For example the cold front off of California is best revealed by the wind shift, a pressure trough, and the presence of towering cumuliform cloud symbols.
Arctic air is found across the Canadian interior. It is rare for such air to reach the Pacific Ocean en masse, since the frigid air is shallow and the Coastal Range forms a barrier that blocks its westward progress. Therefore it is usually assumed the arctic air is blocked and thus fronts are rarely drawn along the Alaskan and Canadian coast. When cold air does reach the Pacific, it usually arrives across the flatlands of western Alaska, as shown in this example. When this happens, rapid development of low pressure (cyclogenesis) is the result. Not surprisingly, deep winter lows are a staple item along Alaska's south coast.
In summary, the Pacific was stormy on this day and it was not at all unusual. Wind-driven waves over the open ocean towered to 20 ft along the Alaskan coast and up to 40 ft just south of the frontal lows. Such waves have been known to destroy cargo ships and capsize weather buoys. So on your next wintertime airline flight from the United States to Asia, don't be fooled by those gloomy gray clouds hanging over the Pacific. There's a lot more energy and motion underneath than meets the eye.
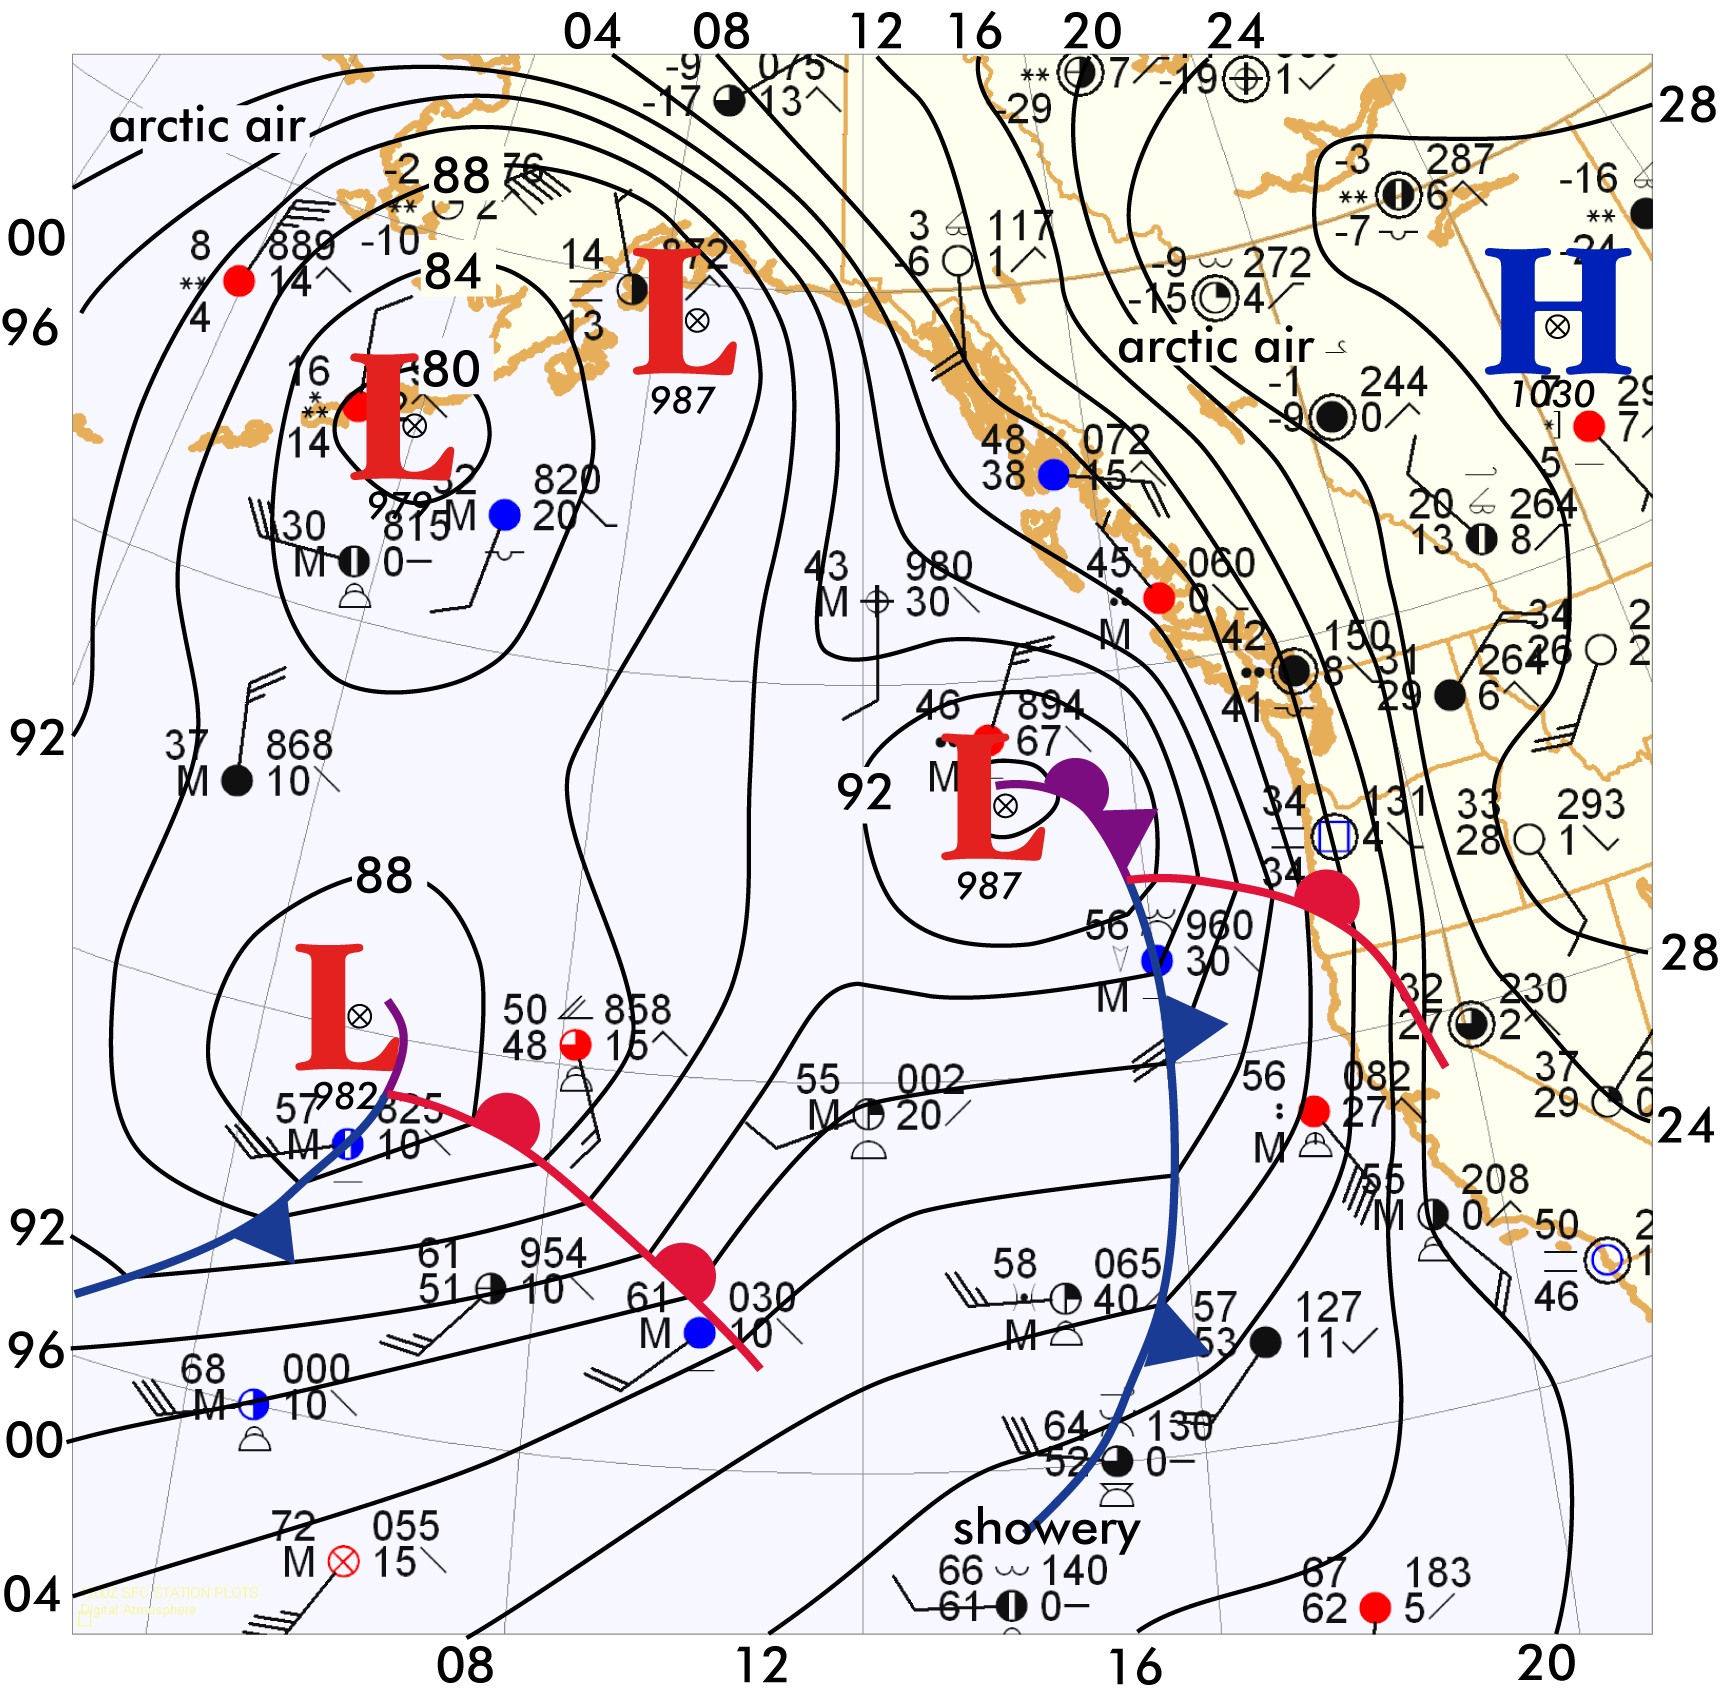
Click to enlarge
©2004 Taylor & Francis
All rights reserved