Page 3 of 4
Posted: Sun Dec 09, 2007 4:10 am
by footballrunner11
weasel2 wrote:I did "smooth" the isobars a little to make them look better, so this may have caused the difference. I'll do one that isn't as smooth. I also only included the station ID and Altimeter setting
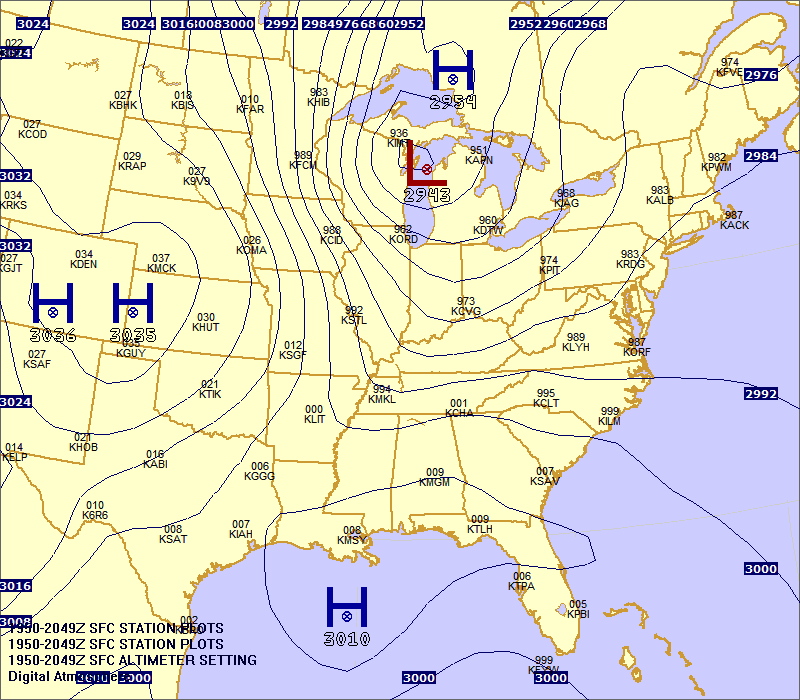
Isn't that the same render?
Posted: Sun Dec 09, 2007 4:15 am
by weasel2
footballrunner11 wrote:Isn't that the same render?
No, remember the station plots were different before. I kept the same filename on photobucket.
Posted: Sun Dec 09, 2007 4:19 am
by footballrunner11
weasel2 wrote:No, remember the station plots were different before. I kept the same filename on photobucket.
But the isobars remained unchanged from what I can see.... am I correct?
Posted: Sun Dec 09, 2007 4:22 am
by weasel2
footballrunner11 wrote:But the isobars remained unchanged from what I can see.... am I correct?
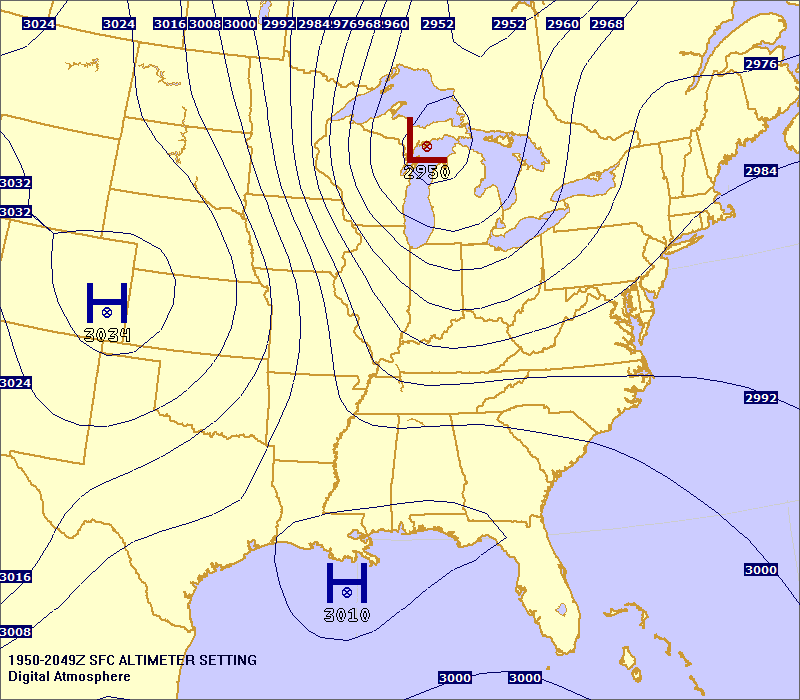
No, there are some differences. Here are the isobars from the original:
Posted: Sun Dec 09, 2007 4:26 am
by footballrunner11
Oh wow, you're right. What was I looking at? lol, the second looks MUCH closer to what my friend had drawn. THANK YOU! You're a lifesaver.

Just oooone last request before I embark on my plotting journey.

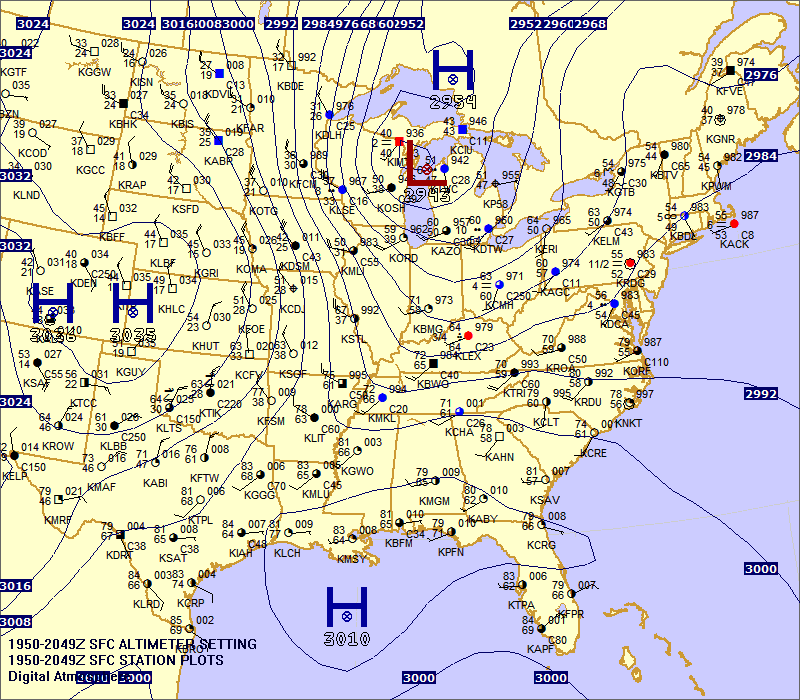
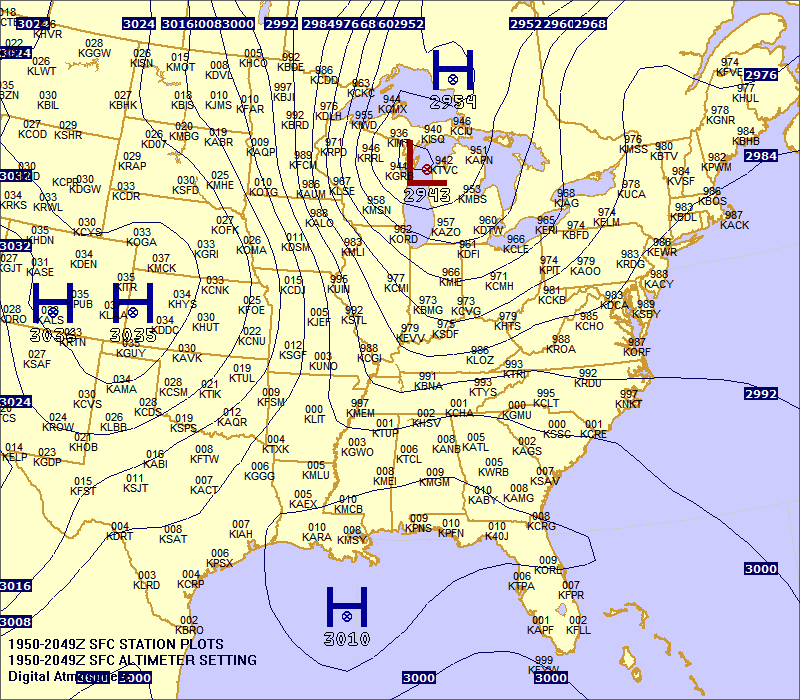
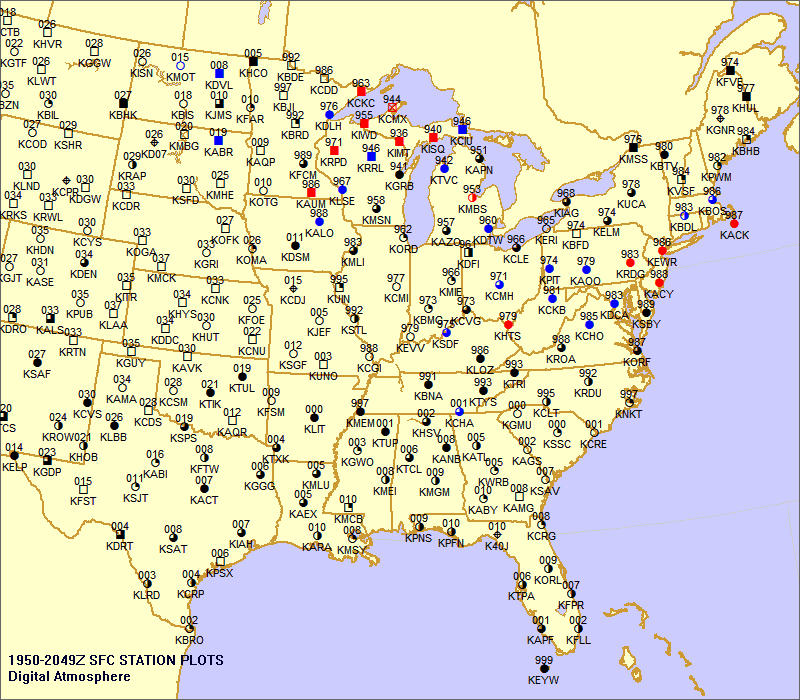
Is there anyway you can include a lot of stations without overcrowding the map? The current stations are just too sparse. Let me know if this is a feasible request. Thanks again!
Posted: Sun Dec 09, 2007 4:35 am
by weasel2
footballrunner11 wrote:Oh wow, you're right. What was I looking at? lol, the second looks MUCH closer to what my friend had drawn. THANK YOU! You're a lifesaver.

Just oooone last request before I embark on my plotting journey.

Is there anyway you can include a lot of stations without overcrowding the map? The current stations are just too sparse. Let me know if this is a feasible request. Thanks again!
Posted: Sun Dec 09, 2007 4:40 am
by footballrunner11
weasel2 wrote:

SWEEET! I really hate to be such a royal pain in the butt. If this can't be done or if you aren't up to it, don't sweat it. You've certainly done enough as it is. The only other request I have is whether or not you could include the station's location as indicated by a dot. That way, I can know if the isobar goes above, below, or through a specific station point. Again, if you can't/don't want to do this, don't worry about it. And I PROMISE that this is my final request.
THANK YOU!
Posted: Sun Dec 09, 2007 4:50 am
by weasel2
footballrunner11 wrote:SWEEET! I really hate to be such a royal pain in the butt. If this can't be done or if you aren't up to it, don't sweat it. You've certainly done enough as it is. The only other request I have is whether or not you could include the station's location as indicated by a dot. That way, I can know if the isobar goes above, below, or through a specific station point. Again, if you can't/don't want to do this, don't worry about it. And I PROMISE that this is my final request.
THANK YOU!
The circle, or square, is the location of the station. There is a way to add a station reference as a dot in Digital Atmosphere, however, it is hard to get the observational density to match the density of the reference.
Posted: Sun Dec 09, 2007 4:52 am
by footballrunner11
Wow, you're my hero!

I am extremely gracious. Thank you very much for your time. I appreciate all of the guidance and help.
Thanks again,
Michael
Posted: Sun Dec 09, 2007 4:55 am
by weasel2
footballrunner11 wrote:Wow, you're my hero!

I am extremely gracious. Thank you very much for your time. I appreciate all of the guidance and help.
Thanks again,
Michael
Michael,
You might want to ignore that high pressure to the north of Lake Superior... that's just a weird little artifact that shouldn't be there lol
Pat


