Page 1 of 2
Equinox....numbers in the Middle
Posted: Fri Jan 12, 2007 2:38 am
by wxforecaster
I dont know how hard this might be and i think this was brought up in the pass but instead of plotting the contour numbers on the edges, is there a way we can plot them in the middle of the line instead or even Both?
With large maps, it is kinda hard to follow the contour if you know what i mean. Thanks!
Posted: Fri Jan 12, 2007 1:32 pm
by Weasel
You can always add labels using photoshop.
Posted: Fri Jan 12, 2007 3:16 pm
by wxforecaster
Yes, you can add lables but when you have lined contours on a 1600x1500 image.. it is hard to see what that line stands for! here is a exsample of what i am doing:
http://www.wxforecaster.com/current/
Now you see why i think having the number in the middle of the line is a good thing? If you know another way around it let me know.
I like the bigger images because it gives you more room to play with!

Posted: Sat Jan 13, 2007 2:23 am
by Weasel
That was actually a small attempt at humor on my part lol
Yeah it is a little hard to figure out what an isopleth value is at times, especially when it forms a circle in the center of the map.
Posted: Sat Jan 13, 2007 5:38 am
by britbob
Yeah, the label clutter can be tricky to avoid, and messy looking if you have tight increments.
Personally I would prefer them within the contours/isopleths themselves like you.
It`s hard to please everyone though. I`m sure I read somewhere that Tim switched them to the outside because people wanted them like that.
Didn`t the very first Digital Atmosphere have them within the isopleths?
Posted: Sat Jan 13, 2007 7:51 am
by Weasel
Dig Atm 2000 would do this to a point, as shown below:
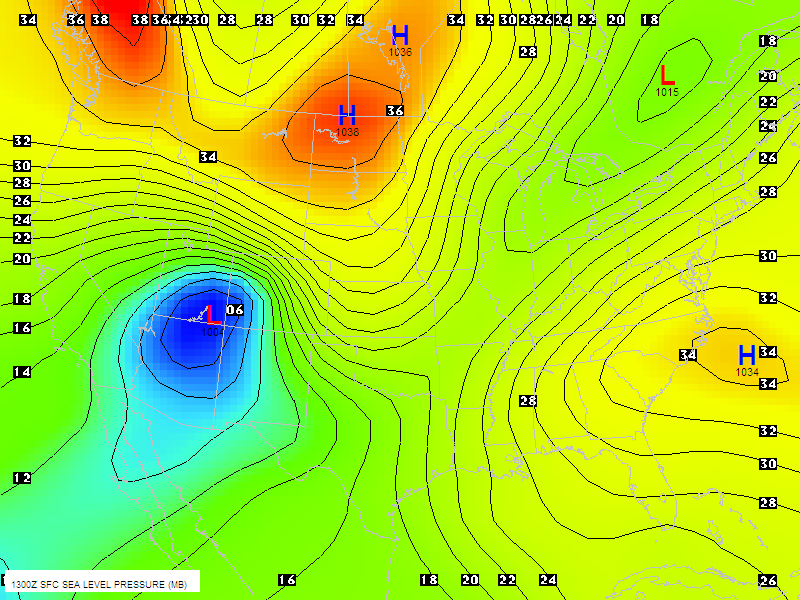
If I remember right somebody did mention labels cluttering the center at one time or other. Maybe Tim could include an option to toggle between the two - maybe set it up where a label is plotted every so many pixels dependent upon map size?
Pat
Posted: Mon Jan 15, 2007 2:42 am
by wxforecaster
Weasel wrote:Dig Atm 2000 would do this to a point, as shown below:
If I remember right somebody did mention labels cluttering the center at one time or other. Maybe Tim could include an option to toggle between the two - maybe set it up where a label is plotted every so many pixels dependent upon map size?
Pat
Pat,
That would be soo soo nice to have back. I think that would really work or at least have the option of putting the "value" of the contour! Hopefully Tim will not be hit too hard with this Ice Storm. Things are Iced over here in LUB but we missed the "really bad" stuff! Just off the CapRock!
Posted: Mon Jan 15, 2007 5:09 am
by Weasel
wxforecaster wrote:
Pat,
That would be soo soo nice to have back. I think that would really work or at least have the option of putting the "value" of the contour! Hopefully Tim will not be hit too hard with this Ice Storm. Things are Iced over here in LUB but we missed the "really bad" stuff! Just off the CapRock!
How bad did the icing get just east of your place, Jon. It looked like it might turn into quite a mess!
Pat
Posted: Mon Jan 15, 2007 5:16 am
by wxforecaster
Weasel wrote:wxforecaster wrote:
Pat,
That would be soo soo nice to have back. I think that would really work or at least have the option of putting the "value" of the contour! Hopefully Tim will not be hit too hard with this Ice Storm. Things are Iced over here in LUB but we missed the "really bad" stuff! Just off the CapRock!
How bad did the icing get just east of your place, Jon. It looked like it might turn into quite a mess!
Pat
Just east of here, like around Pauduca and Guthrie, well i dont wanna even think about it but VERY VERY BAD! Many places around this area has no power because the 2nd surge of cold air is coming in and picking the winds up to around 10-15 mph. Winds + ice = very very bad things!
So far reports all across the South Plains (LUB area) are 1/4"-3/4" of Freezing Rain with about a dusting of snow of top of that east of here!
Jon
Re: Equinox....numbers in the Middle
Posted: Mon Jan 15, 2007 1:08 pm
by rolsch
wxforecaster wrote:I dont know how hard this might be and i think this was brought up in the pass but instead of plotting the contour numbers on the edges, is there a way we can plot them in the middle of the line instead or even Both?
With large maps, it is kinda hard to follow the contour if you know what i mean. Thanks!
Hmm,
is 80% my suggestion:
 http://weathergraphics.com/forum/viewto ... highlight=
I hope, Tim realize this...