I would like to submit a second project with Digital Atmosphere, which is even more important for my investigations than the first submission.
Unfortunately due to lack of time and to some deficiencies of DAEquinox I could not bring this project into a final state, when it will mostly run on its own and produce instability and other charts, which are presently beyond the capability of DA.
Since long I have been waiting for this project, as it will not only bring about an advantage of time for warnings and so forth. The big centers normally do not have an analysis ready before 6 hours after radiosonde time (I hope I am not unjust to them). As the data are on the Web much earlier, charts with plotted and analyzed severe weather data of various kinds can be at hand only one or two hours after the radiosonde time, as soon as enough data have been collected.
The second aim of my project is to have these charts for weather situations of the past which I like to investigate. As it is difficult to foresee which product of a past situation will be needed, it is the only sensible method to have the raw data and produce the chart instead of getting and collecting all the stuff now or later, which may be difficult or impossible at all.
My idea is as follows: There is one very powerful radiosonde evaluation program on the market (you may guess which I am thinking of..., I am a little bit of a beta-tester for it!), which can export many of its analysis results as *.csv data. If it were possible to transfer these results to Digital Atmosphere automatically, so that they can be integrated into the menu structure, this would expand the capability of both (highly estimated) programs and produce charts which are - at least for the hobby-meteorologists - not available and could be a basis for a lot of investigations and comparisons, even using combinations with DA's meteorological analysis fields.
Now, starting with the *.csv-data, I programmed a little VisualBasic routine which realizes, whenever a new *.csv file has emerged. It crunches the data and produces a lot (presently nearly a hundred) files which are custom.dat-compatible. Except the filename of course, so that they can be distinguished. The data cover some features which DA also can produce, but most of them are unique. You may look up the list of parameters in the RAOB help file. Maybe not all of them will be candidates for the menu, but many of them will, quite sure.
The next step would be to rename them and copy them to the DA folder on demand of the menu. Here I am stuck as the SPAWN command could not be convinced to work inspite of many trials with commas and quotation marks and so on. Maybe the fault is between my ears and I need some advice how to do it, but so far no program or batch file would work this way, but would do so by direct double clicking. Of course this can be circumnavigated, but it is much more complicated than necessary.
Well, presently the copying and renaming is done manually. I did, however, not yet streamline and optimize the charts with colours etc. and finally adjust the analysis parameters of the radiosonde program. Functionality had to be there first.
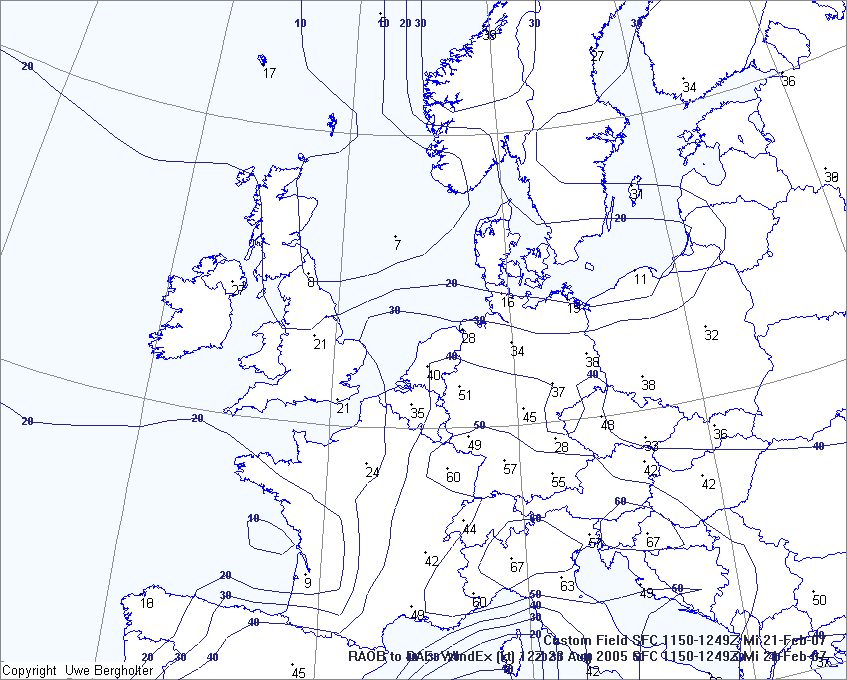
During my experiments with DAEquinox I found out that, although gladly the custom data field is now being analyzed, only the next neighbour mode seems to be operative with the custom data. Weighted average, Barnes and Cressman do not work, but do work with normal meteorological data. A minor item is that some old annotations are not extinguished from the custom analysis, which Stefan Lichius will have reported already on my behalf. Perhaps you could also provide an option to erase the chart in the area of the custom text (line #2 of custom.dat), like it is done for the title. The date on the charts is incorrect, the reason is possibly in RAOB, I'll find out where it happens.
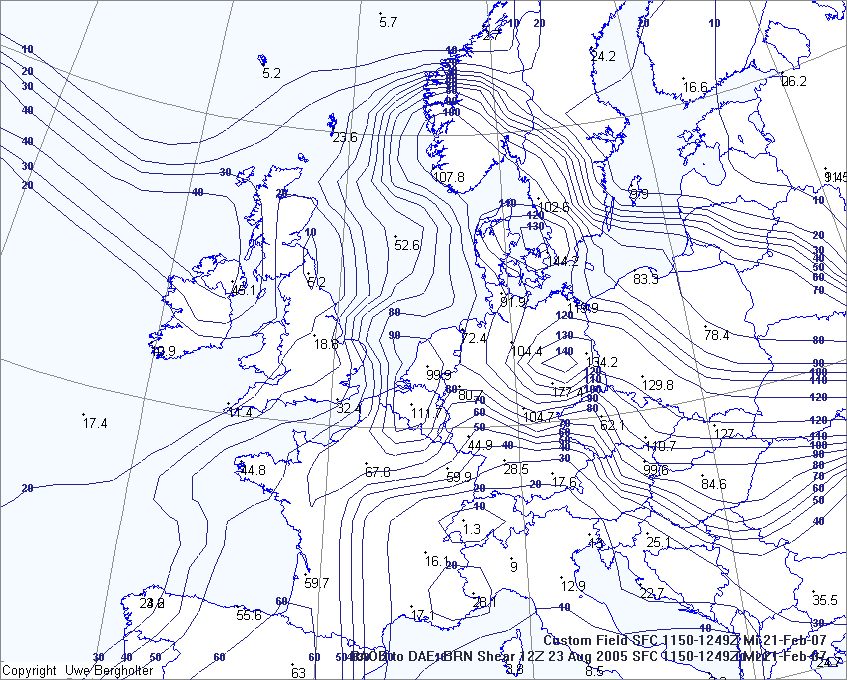
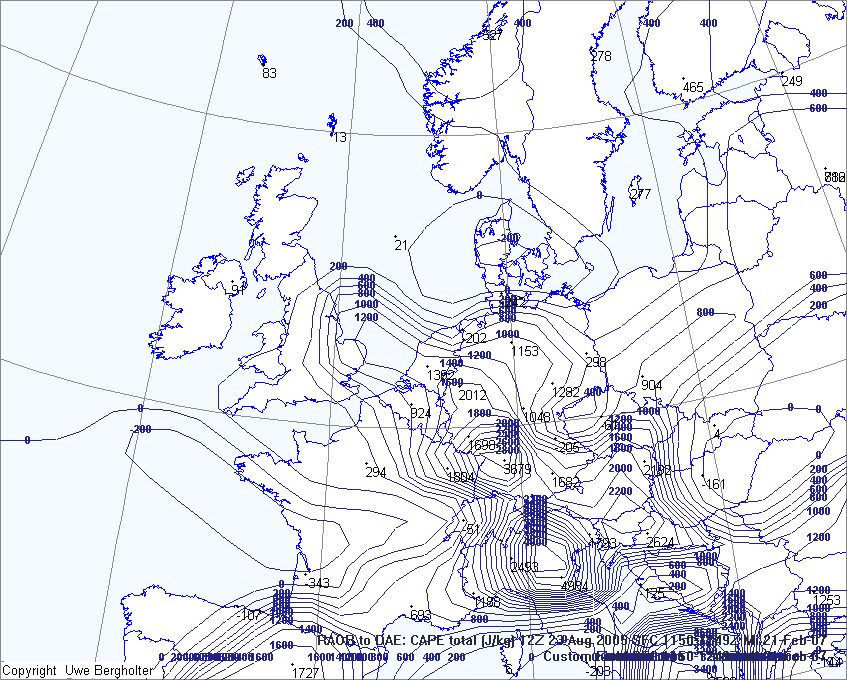
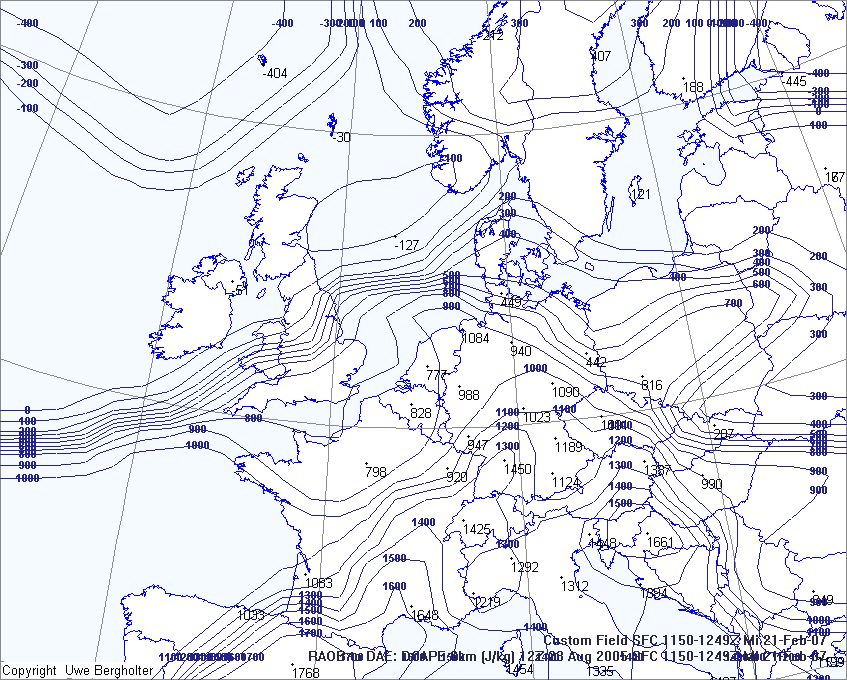
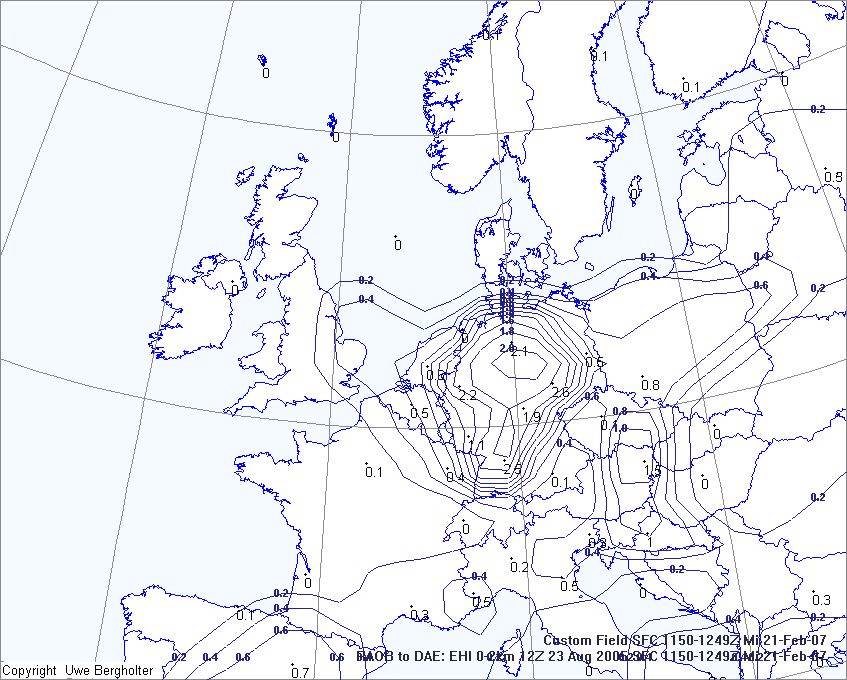
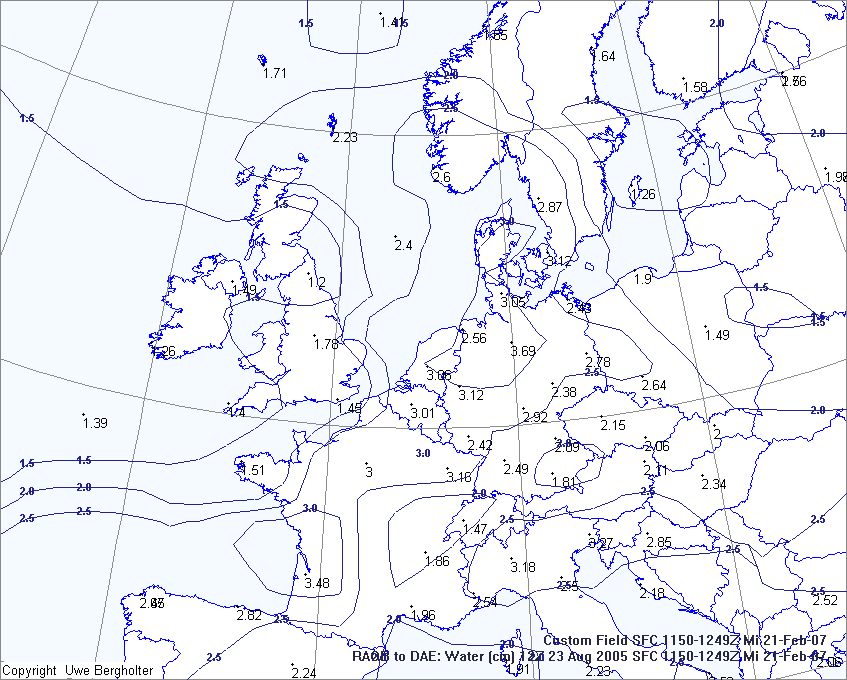
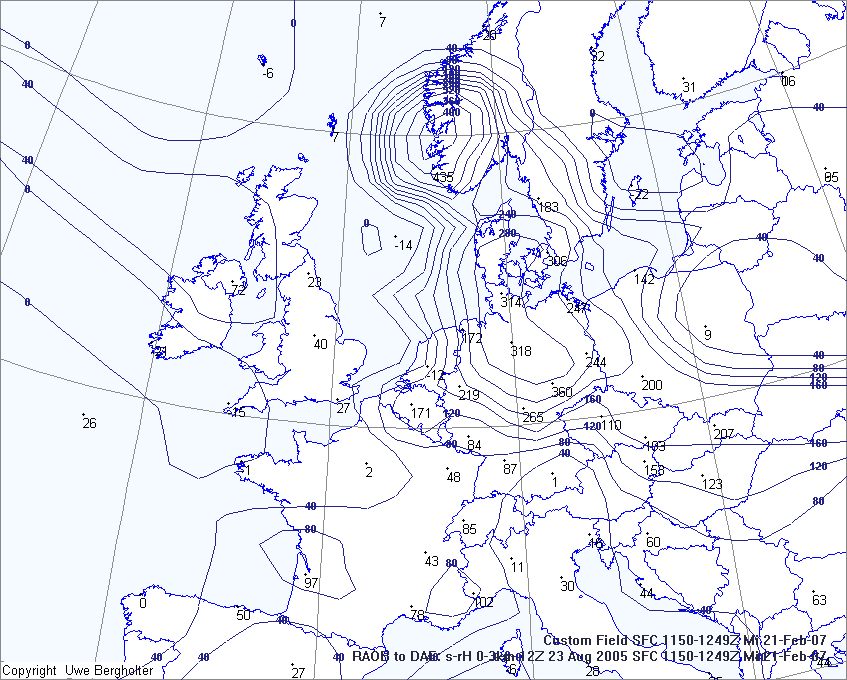
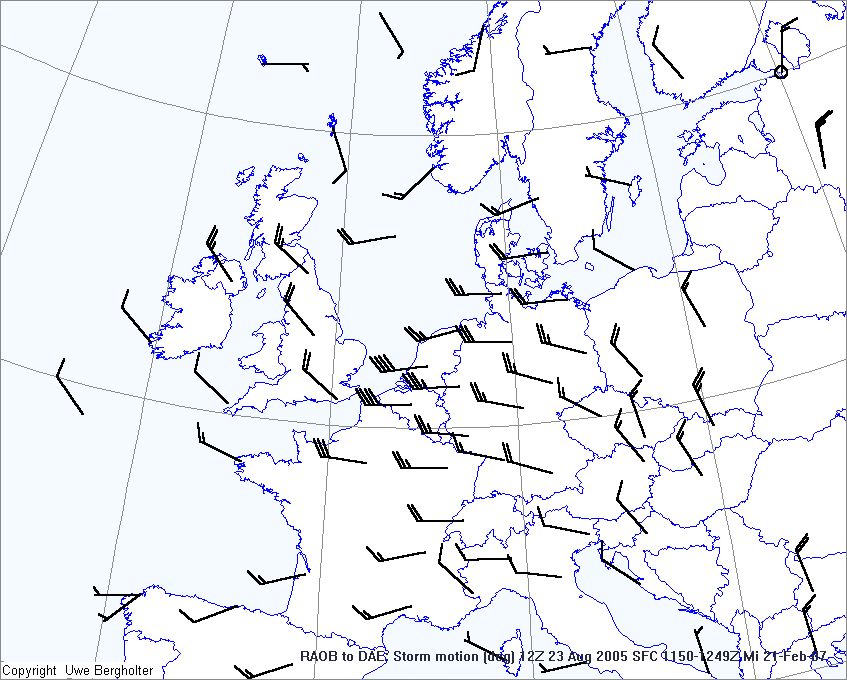
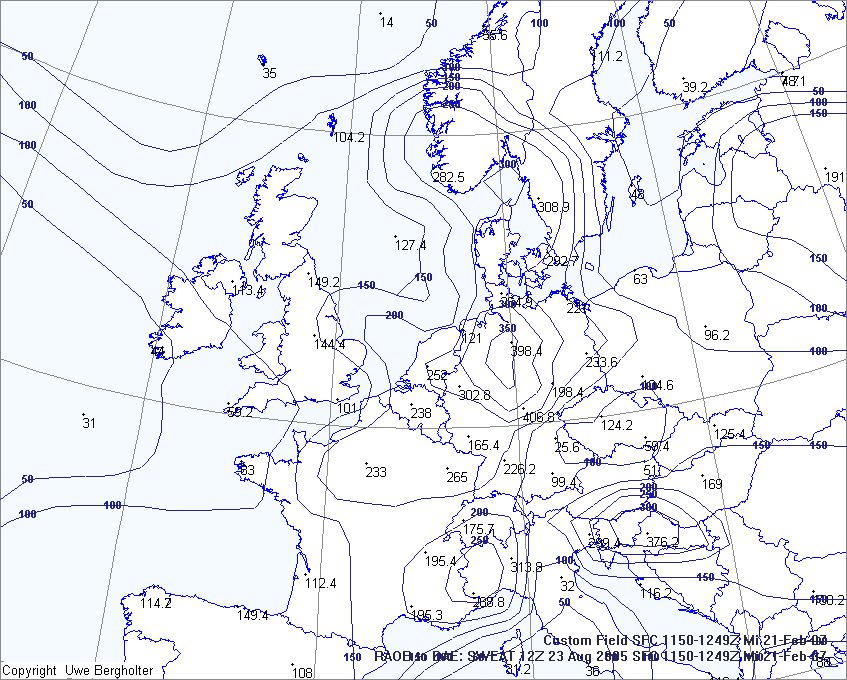
The attached examples are from radiosonde data of June 23rd, 2003 when a tornado event, possibly a downburst with an accompanying Tornado, was reported close by, some 10 km north of Hamburg. The damage is estimated to reach F2. While most of the damage was near the touch down area, I could trace the swath over 7-8 km.