SATELLITE IMAGES AND RADAR
SOME NOTES
Meteo
Maarssen has not a 24/7 operation service. Any service may interrupted
without any notice. Updates on this page are on usual on 18:00 CET, but
there might be some delays.
Materiaal on the page is protected by copyright: Meteosat images (Eumetsat); NOAA (NOAA); Weatherradar (KNMI/Meteox/Buienradar): See the notices on the disclamer.
MORE INFORMATION :
Earth at Large (Ferdinand Valk)
Software from David Taylor (processing satellite images)
Software from WeatherGraphics (processing weathermapoverlays)
Feel free to send comments about this page Meteo Maarssen (Ton Lindemann).
COLOR LINE FOR INFRARED IMAGES
NORTH ATLANTIC OCEAN AND EUROPE
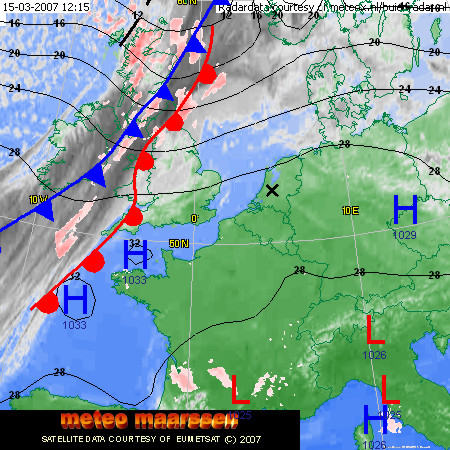
The Meteosat 8 images are displayed with a weathermap and fronts: Warmfront, Coldfront, Occlusion, Stationair front, trough: black in IR and green in VIS.
INFRARED 00 UTC
Images taken in the infrared channel and displayed with a colorcode. Cold cloudtops are pink and red, fading to yellow and gray for warmer cloudtops. Cold cloudstops are often bouderies from airmasses naer fronts and can produce precipitation. Use the colorbar to find the temperatures of the clouds.
VISUAL 12 UTC
A false color composite from the visual and thermal channel. Pink are cold ice clouds and the yellow/greenish clouds are waterclouds near the surface.
 |
 |
|
|
WORLD WEATHER ATLAS

Composite of Goes 11, 12, Meteosat 8, Meteosat 5 and MTSat
Click on the image for a larger format.
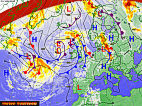
The World weather atlas is a worldwide overview in infrared from satellite images. Images form all geostationary satellite are merged to a full map for each continent or oceanic region. All infrared imaged are colored to spot the cold cloudtops, frontal bouderies, cyclones or thunderstorms. Each image is completed with a real weathermap to determinate high's and lows.
HURRICAN WATCH
Infrared satellite images from van 12 UTC with weathermaps for all regions where cylcones exists.
SEA-ICE AND SEAWATER TEMPERATURES
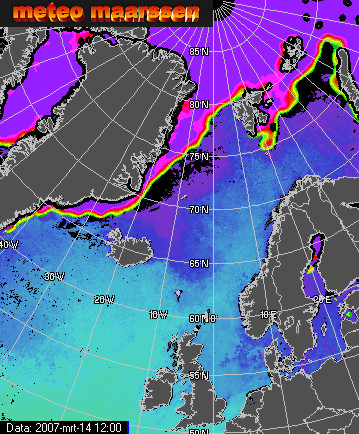 |
The
map left shows the sea ice distribution of of the Nor-thern Atlantic
and the seawa-ter temperatures of the waters in the Nothern Atlantic
Ocean.
|
EURORADAR
|
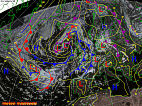
This Euroradar image is a merged composite taken from national weatherservices from countries in Western Europe. The final result is published on a Meteosat 8 frame. Precipitation intensity is given in shades of red. Light red correspondences with light precipitation, and dark red to brown with heavy preciptitation. Be
warned that radar may give some false signal in some cases. Then you
will see some precipitation on clear skies. We can't prefent this.
|