How I use Digital Atmosphere
Fred van den Bosch / February 2007
This paper describes how I use Digital Atmosphere. First I tell how I started with the program
and my two main ideas about the use: automating the whole process and integrating it with
weather satellite images. I give some hints about automating the whole process, followed by
an introduction about weather satellites. I show the different types of satellites and explain
how to use them as background image in Digital Atmosphere.
New sources of information are maps and images from the Deutsche Wetterdienst.
To manage all that information I developed POVIM. I explain what I did to structure my
system and to view all the maps and images. Finally I give an impression of my system and I
present some future plans and wishes.
1. Introduction
For many years I am receiving weather satellites. About 25 years ago it was only possible to
receive some polar satellites. Today there are a couple of polar satellites, 5 geostationary
satellites and you also have the possibility to receive images from internet.
A couple of years ago I also started with Digital Atmosphere. Rather soon I wanted to
automate the whole process. This to make it easy for myself: all maps that are needed are
ready to view. It started with some easy scripts and rather quick I had a lot, also helped by the
forum where other users published some nice scripts. For some time DA made every hour a
couple of maps, fully automated. But I wanted more.
The next idea was to integrate DA with the weather satellite images. My final goal was to
have not only the basic maps, but also images with weather information on it, all fully
automated. Of course the interactive working with DA is always possible to see specific
situations that are not automated.
In the following paragraphs I describe what I have done to realize it.
2. Automating Digital Atmosphere
First I started to make some structure in different parts. I made two new folders:
maps -
In this folder I store all the different maps I have made. I have maps for background
images, color-fill and lines. Here I have added the type (lines etc.) to the filename.
scripts -
I made some subfolders for the different type of scripts: import, export, fill, line,
overlay and test for not-yet-finished scripts.
Next step was to make a couple of scripts for hourly running. I did that by combining a couple
of small “basic” scripts into one “main” script. See also my wishes at the end of the paper.
This “main” script was entered into the DA-scheduler. Downloading from the internet and
making maps are –in my case- separate scripts. A lot of scripts can be found on the DA2
forum. But it’s nicer to make your own scripts. I have written an article [1] for GEO, the
Group for Earth Observation, where I explain into detail how to make and test scripts. Back
issues are still available via their website [2].
3. Integrating Digital Atmosphere and weather satellite images
After the scripts produced their hourly maps it was time for the next challenge: making the
weather satellites images to a background for the weather maps. Before I describe how this
can be done I first will give some general information about satellites. There are two types of
weather satellites, polar and geostationary.
3.1. Polar satellites.
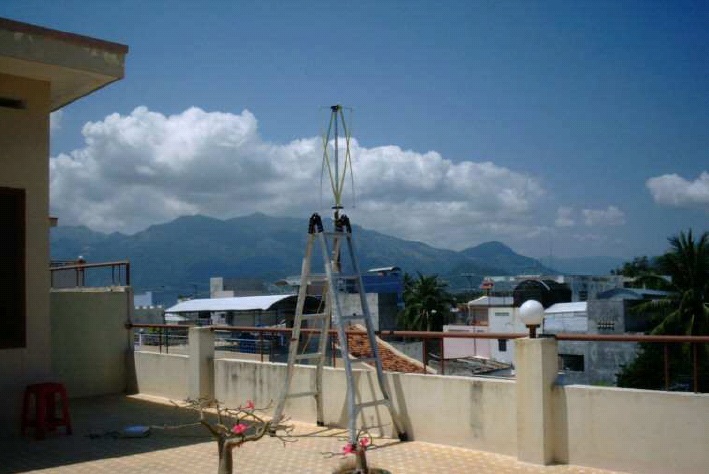
Polar satellites are flying
around the earth on a height
of about 840 km. They are
sending their signals on 137
MHz. With a cheap receiver
[3] and simple antenna
receiving their signals is
relatively simple. The photo
shows my mobile station
during a holiday in Vietnam.
At the moment there are 4
satellites that you can
receive a couple of times a
day. There are several
programs for decoding the
signals: Wxtoimg [4],
SatSignal [5] and
APTDecoder [6]. The last
program is freeware.
Personally I use Wxtoimg
and sometimes
APTDecoder.
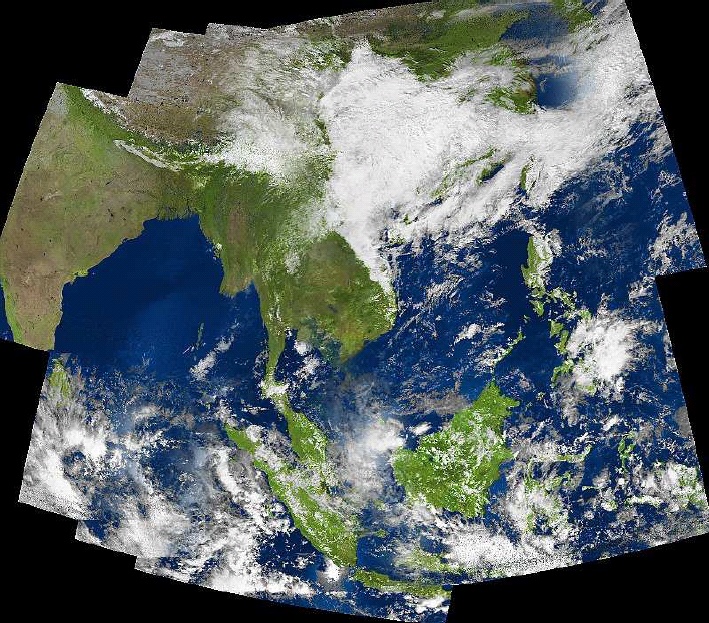
The photo shows a
composite image from a
couple of passes with
Vietnam in the middle. The
images from polar satellites
can be used as a
background. Disadvantage
is that they are not sent on a
fixed time every day. That’s
why they less suitable to use
as the images from the
geostationary satellites.
Nevertheless it’s possible and not so difficult. Here is an abstract of an article I wrote for the
GEO Quarterly [7] that explains how to use them.
3.1.1. Initial.
Wxtoimg - Set in the following parameters: latitude, longitude, north,
south, west, east, scale. Choose values that will give the image you want. Remove the mark
by “disable map overlay”, choose in for “Orthographic” and generate the image.
Write down the size in pixels (they will appear on the bottom of the screen, just before
showing the image), choose [Image/White background] and save the image as BMP.
Digital Atmosphere - Generate a map. Use for latitude and longitude the same values as in Wxtoimg. Use for scale
a size that generates more or less the same map as Wxtoimg. It is not so important at this
moment. Give width en height the values from Wxtoimg. Generate the map and if it’s ok,
save it with [Map/Save map] as BMP.
3.1.2. Fine-tuning.
Repeat the next steps until both maps fits exactly.
- Choose icon “load map” and read the Wxtoimg image.
- Choose
It can happen that meridians do not fit exactly onto each other. Then you can rotate the image
in Wxtoimg by changing the “reference longitude”.
3.1.3. Finishing.
Save the DA-map for the last time. This must be done because every lay-out has its own base
map and parameter-files. Always open this corresponding map before loading a picture with a
different layout from Wxtoimg.
The dimensions of the map can be changed by modifying the “width” in the parameter of
Wxtoimg. Give width en height in DA the same values as in Wxtoimg.
3.2. Geostationary satellites
Geostationary satellites are on a fixed point in the sky. At the moment there are several
satellites active. The most important for the amateur are Meteosat 8, GOES-11, GOES-12 and
MTSAT-1R. Meteosat covers Europe and Africa, GOES covers America and MTSAT Asia.
There are 2 ways to receive them: via an antenna and via internet. There are also differences
between America and Europe.
3.2.1. Europe.
In Europe it is possible to receive the signals via an 80 cm. dish. A receiving program is
needed and you must register at Eumetsat [8]. Beside that some programs are needed to
handle the received files and convert them into images. Suitable are the programs of David
Taylor [5] and Rob Alblas (freeware) [9]. Via David Taylor’s GeoSatSignal it is possible to
make images that can be used as background for Digital Atmosphere.
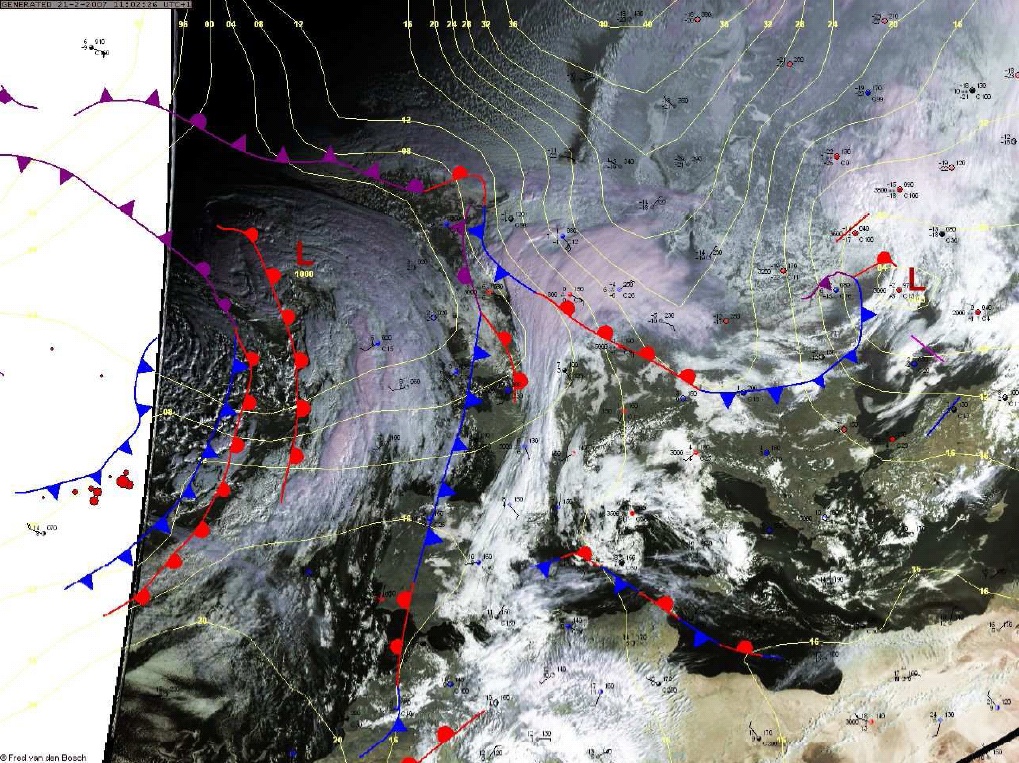
This is an example of an image with added fleet code. The left part of the chart is white
because that’s the border of what the satellite can see. I left it because I want to see the isobars
etc. there. The procedure to make the image fit in Digital Atmosphere is the same as described
in 3.1.
3.2.2. America.
It is possible to receive signals via C-band. I don’t have experience in this field but it is
possible to view if you are within the footprint for all EUMETCast services [10]. You are
lucky if you are in the footprint for the C-band Africa service, because this has more services
than the American service.
3.2.3. Internet.
The only MSG data you can download via the internet is the low resolution (LRIT) data.
Disadvantage is that it’s only Europe. You will not need the user key or receiving software for
this. You must only register with Eumetsat to get a username/password to access their site. I
don’t have experience with downloading LRIT either.
4. Weather maps
Since September 2006 it is possible to receive maps, synops and weather satellite images from
the Deutsche Wetterdienst (DWDSAT) for free. This information is received by satellite, but
can also be downloaded from internet. I must emphasize that this is mainly information about
Europe.
Most used maps will be the ones that start with fx401. A big help to know what the maps are,
is the Products Catalogue. It can be downloaded from the site of the Deutsche Wetter Dienst
http://www.dwd.de/en/Technik/Kommunikation/dwdsat/prodkat.htm
It’s a good idea to print it for a quick lookup.
On the same site you can find a comprehensive explanation under “Explanations to the
product catalogue”.
There are files beginning with “sat”. These are satellite images and can be viewed with a
photo viewer or with “DWDSAT HRPT Viewer”, a program of David Taylor [5]. This
program can also read files with the extension .BZ2.
Files, beginning with “grb” can be read with “GribViewer”, also from David Taylor [5].
This all can be a good addition to Digital Atmosphere.
5. POVIM: Managing all images and maps
5.1. Introduction
The primary reason for the development of POVIM is simple: my system was starting to get
into a bit of a mess. I had a lot of different satellite images and Digital Atmosphere maps. I
continually had to search where specific files had been stored. Designing a logical structure
for my whole system solved that problem [12]. Of course Digital Atmosphere fits smoothly in
this structure.
It was also difficult to view same maps/images in time. Designing and building a specific
viewer did the trick.
First I will explain something about POVIM. Then I will show how the Product- and
Presentation Manager are performing and how this can be a great advantage for Digital
Atmosphere maps.
5.2. POVIM in general
I made a presentation at the GEO 2005 Symposium [2] under the above title. POVIM is a
framework for Product Oriented Video, Images and Maps. It provides the functional design
for:
the automation of computer programs
a separate reception PC
a master folder containing a hierarchy of sub-folders
a convention of systematic filenames throughout
everything in a logical and consistent structure.
5.3. POVIM Product Manager
During the above step I decided to use the term “products”. A product can be an image, a
video or a map. In fact everything is a product. Every product has unique attributes like name,
folder, type (image, map etc.). So products are for instance: a surface map with fleet codes, a
map with temperatures, a map with plots, an image of a certain area or a video of a certain
area.
To view all products I first used a simple photo viewer. But I wanted more functionality. So I
decided to develop my own viewer: POVIM Product Manager (PM). POVIM PM integrates
all the separate programs. POVIM PM consists of 2 parts: the Product Manager and the
Presentation Manager and offers the following possibilities.
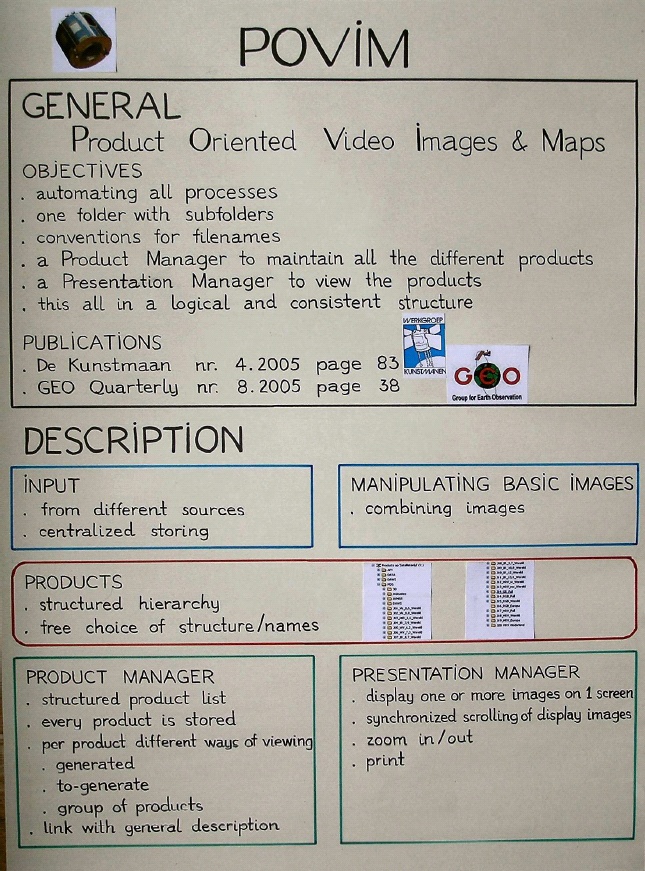
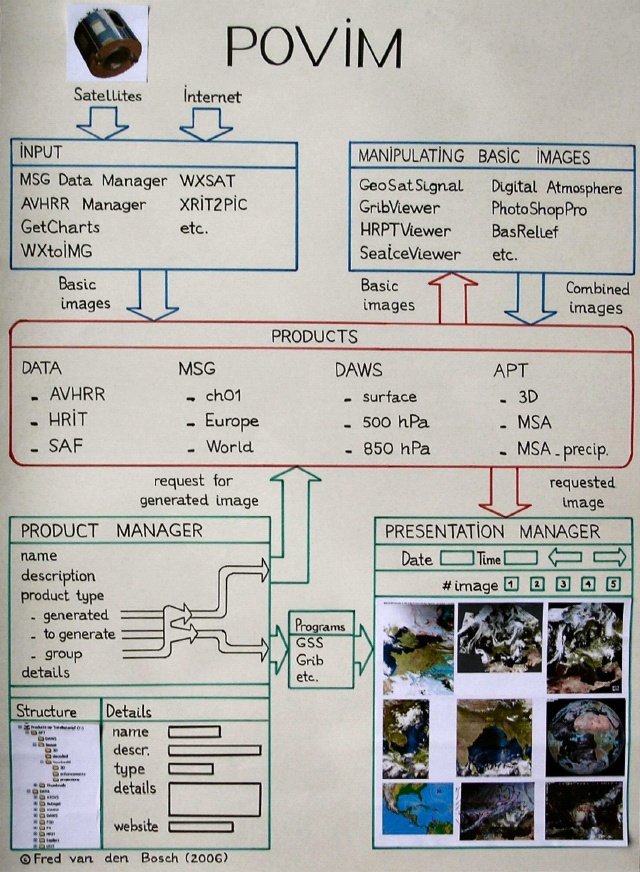
5.3.1. Product Manager.
create your own products and where they are stored
structure products into maximal 3 levels
every level can be defined to your own choice
combine same type of products into groups e.g. Oceans, Hurricanes, Europe etc.
a product can be
; generated: there is already an image
; to-generate: make the image during presenting
; a group: a couple generated / to-generate
make files with basic information
define all the programs you use for weather satellites and weather watching.
5.3.2. Presentation Manager.
selecting up to 20 products from a list of products
present them in thumbnails
synchronized scrolling in steps of 5, 15 and 60 minutes
call your favourite photo viewer to see the images on full screen
use all the options of your photo viewer like zoom, scroll and print
choose a different date and time
display generated images or generate the image "on the flow"
present details for every image (if in the database)
display the latest received image in case it does not has a periodicity of 15 minutes
display images (jpg, bmp) video (avi, mpeg) and maps(jpg, bmp) from e.g. Digital
Atmosphere
start satellite- or weather program or go to a specific internet site. In this way you can
e.g. start Digital Atmosphere directly to show a specific situation or visit sites for
lightning and radar. The radar sites are mainly for the European users.
directly start the photo viewer to see the content of all the folders in thumbnails
; this is of course depending on the options your viewer provides.

5.4. POVIM and Digital Atmosphere
One of the main advantages of POVIM is that you can define the different DA-maps as
products. Then you can view a couple of products at the same time and scroll them in time to
view the development of certain phenomena. On the above figure you see the main screen
with some selected products. Clicking on a map starts the photo viewer to show the
map/image on full-screen. The DWDSAT maps can also be added as products.
5.5. RotateDWDSAT
Some DWDSAT maps are 45 degr. rotated. This is a separate program I made to rotate them
and convert them to jpg. The converting has two reasons:
to know what files are converted
jpg’s are easier to use in Visual Basic programs.
By doing this you can directly view the received maps in their “normal” presentation.
5.6. Downloads from my website
All programs I mentioned here (and some others) can be downloaded from my website [12]
for free. You will find a more comprehensive description on my website.
6. System
Personally I use 3 computers for running the above described programs:
Receiving (running 24/7)
On this pc I receive the weather satellites and make basic images of the signals.
Processing (running 24/7)
This system runs all scheduled programs
; Making color images of the basic satellite images
; Making Digital Atmosphere maps: lines, color filled and with satellite
backgrounds
; Running my weather station
Main system (running when necessary)
Here runs POVIM. From here I can go to the other two systems to get my images and
maps.
Of course such an extended system is not a must. Even with just one pc you can receive or
download satellite images and combine them.
7. Future
Currently everything is working fine. But of course there are some wishes and plans to
improve the system.
7.1. Plans
I have a lot of plans for improving a lot of things. Two of the most important are:
Better website
In the near future I want to add some more charts to my website. This will be a
combination of “normal” charts and charts with a satellite image as background. Also
some cloud movies will be added.
POVIM Presentation Manager
I want to try to make it easier to add new products to the program.
7.2. Wishes
The wishes are most for Digital Atmosphere in combination with the automation of the
processes. My main target is to make Digital Atmosphere as easy, user-friendly and most of
all as automated as possible. So in my opinion the following will be a big improvement:
Default folders
The use of default folders in preferences for scripts, maps etc. The advantage is that
you can place the folders on a place where it is easy to add them to the daily
(automated) backup. Also when you want to use a script or a map you directly are in
that folder.
Using scripts in menu
Things would be much easier when it’s possible to call a script from a menu option.
You don’t have to add a lot of lines to the menu for using a complicated function but
you can make a script. This is more structured then directly calling a script.
Calling scripts
I like to have a function where you can call another script file:
CALL, filename
where filename is a valid script name. In this way you can make and test small scripts,
give them a useful name and if they are OK add them easily to the existing script. This
will give much more structure and flexibility to the scripting.
8. References
[1] Using scripts in Digital Atmosphere, Fred van den Bosch, GEO Quarterly, September
2005
[2] Group for Earth Observation, http://www.geo-web.org.uk/index.html
[3] R2FX receiver, http://www.df2fq.de/produkte/r2fx.html
[4] WXtoImg, http://www.wxtoimg.com
[5] SatSignal, David Taylor, http://www.satsignal.net
[6] APTDecoder, http://www.ptast.com/apt/decoder/index.html
[7] Using Wxtoimg images in Digital Atmosphere, Fred van den Bosch, GEO Quarterly, May 2004
[8] Eumetsat, http://www.eumetsat.int/Home/index.htm
[9] Xrit2pic, Rob Alblas, http://www.alblas.demon.nl/wsat/
[10] Footprint Eumetcast services, http://www.eumetsat.int/Home/Main/What_We_Do/EUMETCast/index.htm?l=en
[11] DWDSAT, http://www.dwd.de/en/Technik/Kommunikation/dwdsat/
[12] POVIM, Fred van den Bosch, http://www.fredvandenbosch.nl