Austin astronomy cloud forecasts
Generated manually for astronomy events of interest or upon request.
These charts are not manually updated. If you have questions,
or ideas for other parameters that might help amateur
astronomers, please E-mail
.
Forecast for
AAS astronomer's night
valid May 23 2004 06Z (1 am Sunday morning)
using
May 22 2004 12Z 18 hr fcst
data.
NOTE: Low level moisture
was shown as being shallow, with greatest depth W-NW of San Antonio,
so take these panels with a grain of salt.
About these maps
These maps depict the maximum relative humidity values in specific layers
of the atmosphere at the forecast time.
Values above 60% are indicative of a slight cloud risk or a thin layer,
and values above 80% carry a high degree of probability of clouds.
Source data is the latest NOAA/NCEP Eta model.
Be aware that all numerical weather models have errors and
may be unrepresentative of actual conditions.
The general pattern of clouds shown is often much more useful than
their specific locations.
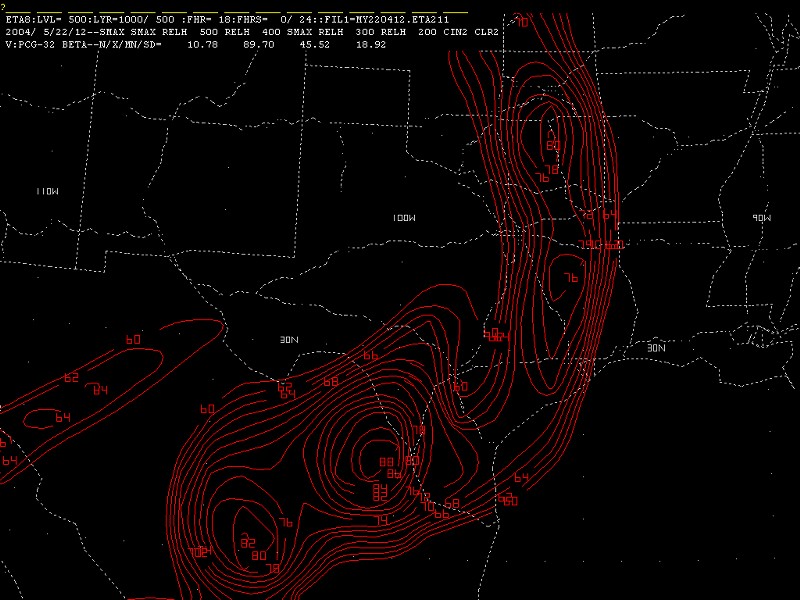
High cloud (cirrus and cirrostratus)
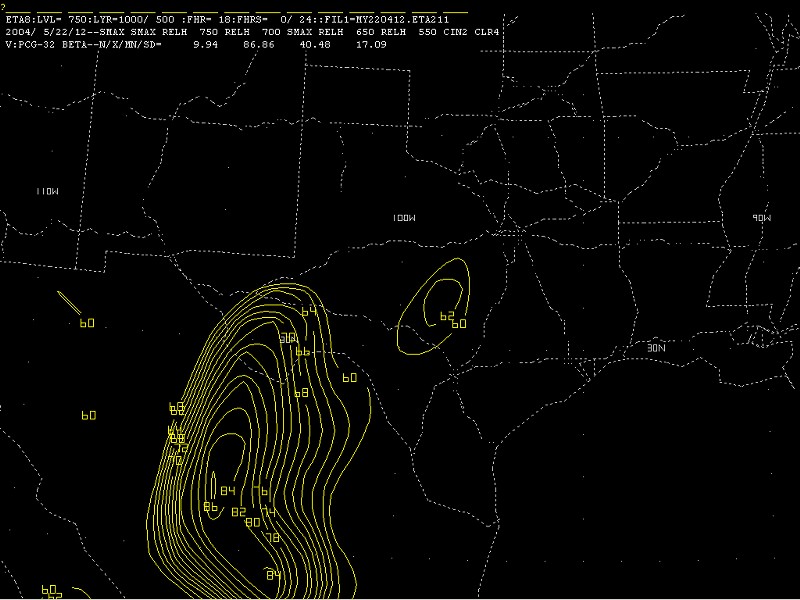
Middle cloud (altocumulus and altostratus)
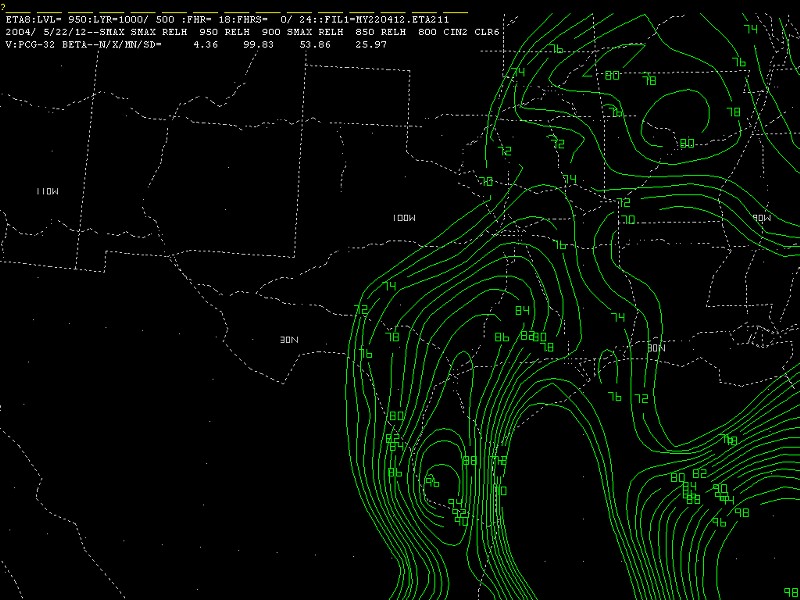
Low cloud (stratus, stratocumulus, etc)
Return to astronomy page
Return to main page