


Global Surface Archives is the single largest collection of hourly and special METAR
and SYNOP weather observations in existence. Using any off-the-shelf viewer
like Digital Atmosphere, you can plot historical charts for anywhere in the world
for any hour, even with ship reports (after 1973).
You don't get complex XML or JSON records, or proprietary binary files.
All data is in plaintext (SYNOP, METAR, and CSV) and is designed for maximum portability.
These standard formats are familiar to almost all meteorologists and can be plotted with
a variety of off-the-shelf software tools or simply opened in any text editor (e.g. Notepad).
For detailed historical maps, researchers traditionally had to rely on the NCEP Reanalysis series, which is a binary dataset requiring
specialized viewers and is mostly limited to 250 km resolution. These are not always adequate for case studies or
mesoscale reconstructions. In Global Surface Archives, you have all of the actual observations
and can build the most demanding mesoscale analyses for years gone by, whether you're looking at 2012's Hurricane Sandy
or the 1984 Ivanovo tornado in the former USSR.
Global Surface Archives represents so much processing work that it took 1 month of continuous processing
time to complete our original 2010 release on an Intel Core i7 machine.
Details
■ Current period of record: January 1, 1930 to 2026 with a courtesy update up to the approximate date of purchase.
■ Available formats: METAR and SYNOP ordered by date-time. Volumes 2 and 3 contain data sorted by station in SYNOP, METAR, and tabular (CSV) format.
■ Displayable as maps?: Yes - Volume 1 can be plotted with Digital Atmosphere, GEMPAK, or other display software.
■ Displayable as text?: Yes - Volumes 1 and 2 are in text format.
■ Displayable as a spreadsheet?: Yes - Volume 3 is in CSV format (Excel, OpenOffice, etc). One file per station year.
■ Operating systems: All, including Windows and Linux. This is a data package.
■ Media: This product is delivered on a portable USB external hard drive (normally 500 GB) or 256 GB flash drive that is yours to keep.
■ Size: ~175 GB compressed (apprx 1-1.5 terabytes if fully uncompressed)
■ Author: Developed and produced by Tim Vasquez / Weather Graphics
Global Upper Archives (radiosonde data)
Add the new Global Upper Archives dataset! Click here for more information.
Information on Lifetime Updates
If you have Lifetime Updates or are thinking about purchasing it, please read this important information:
When will there be an update?
Updates are every six months: in January and July.
What's the procedure for Lifetime Updates?
Updates are placed on our website for download. The link will be sent to you when you place the order.
These are new files that you can unzip and use as-is or merge with your existing product.
Can I get a special Lifetime Update to make all the data current through today?
Yes. If you want Lifetime Updates updated through the current date, this is
available for a $95 service charge either at the time of purchase or any date after your purchase.
Click here
to place this in your cart. Allow anywhere from 2 to 7 days to build the data.
What if I don't want to download the Lifetime Updates patches? What if I want them on a USB drive?
If you prefer physical media or can't download the updates, we will be glad to provide a fully updated Global Archives
package on a USB drive at your expense for the actual costs of shipping and the drive.
Please contact us to work out an arrangement.
Terms and conditions.
This program is intended to allow customers to receive updates to Global Archives, providing we are continuing
to maintain it, at no cost except for the actual
costs incurred by Weather Graphics, typically raw materials and postage. The guarantee provided to you is to
provide you a method of getting updates as we continue to sell that product without having to re-purchase it.
Terms and conditions are subject to change.
Technical aspects of Global Surface Archives
Contents
Global Surface Archives is a ultra-massive collection of worldwide "hourly" and "synoptic" weather observations in two of the most universal formats for weather data distribution. The size of this dataset is approximately 175 GB (~1.25 GB uncompressed).
Documentation
Refer to the documentation (590 KB, PDF) for details about the Volume 3 comma-delimited data and for other information about this dataset.
Identifiers
METAR data is indexed according to standard ICAO codes.
SYNOP data is indexed according to standard 5-digit World Meteorological Organization station numbers.
For all observations at obsolete identifer locations, identifiers are automatically corrected to a
currently accepted identifier for that location. This mainly affects certain METAR locations that were moved.
For example, in 1995 the ICAO identifier KDEN was moved from Stapleton
Airport to the new Denver Intl Airport 14 miles away. Therefore, in Global Surface Archives, KDNR is applied
to the old Stapleton location, even though it reported under KDEN at the time. If data from Stapleton
Airport in 1974 was indexed under the KDEN identifier, it would erroneously plot at the new Denver Intl
Airport location (which was not built at the time) in nearly all modern display and analysis software.
This would provide misleading depictions in historical mesoanalysis plots.
KDNR is a valid identifer for the old Denver Stapleton location, though it was retired after the old
airport was removed.
Period of record and coverage
Datasets start in 1930, though a few records exist for Finland and France going back to 1920 and were included. The data is sufficiently dense to allow synoptic maps of the US in the late 1930s and for parts of the US and Europe in the 1940s. It may be impractical to construct satisfactory maps of various areas until the 1940s and 1950s.
Also, much of the older data is reassembled from "packed" records. Before the 1980s mass storage space was extremely expensive and archiving data in original form was considered wasteful. All METAR data is also standardized to the post-1996 standard, which is generally considered to be a bonus but does cause some degradation of sky condition data, which was encoded in a different system before then (e.g. 7CI250 vs. 250 BKN). There is a known reduction in observations between 1969 and 1972 due to data losses at the telecommunications centers and results in data not being available in some countries; the data loss episode peaked at 1972 before recovering rapidly in 1973. Observations subject to WMO Resolution 40 restrictions (generally 3-hour SYNOP from certain countries) are not included.
Inventory
A basic inventory of the dataset is provided here. This update was prepared in January 2026 and has not been
updated for newer updates. Note that sites under older locations and older identifiers are standardized
to be compatible with current station tables, since older identifier references are difficult to find and are
not compatible with analysis tools and display programs.
station_inventory_1920-1929.txt - 1920-1929
station_inventory_1930-1939.txt - 1930-1939
station_inventory_1940-1949.txt - 1940-1949
station_inventory_1950-1959.txt - 1950-1959
station_inventory_1960-1969.txt - 1960-1969
station_inventory_1970-1979.txt - 1970-1979
station_inventory_1980-1989.txt - 1980-1989
station_inventory_1990-1999.txt - 1990-1999
station_inventory_2000-2009.txt - 2000-2009
station_inventory_2010-2019.txt - 2010-2019
station_inventory_2020-2029.txt - 2020-2029
Archive volumes
This dataset is made up of three different volumes. Different volumes contain the exact same information as other volumes, but are sorted or formatted different ways.
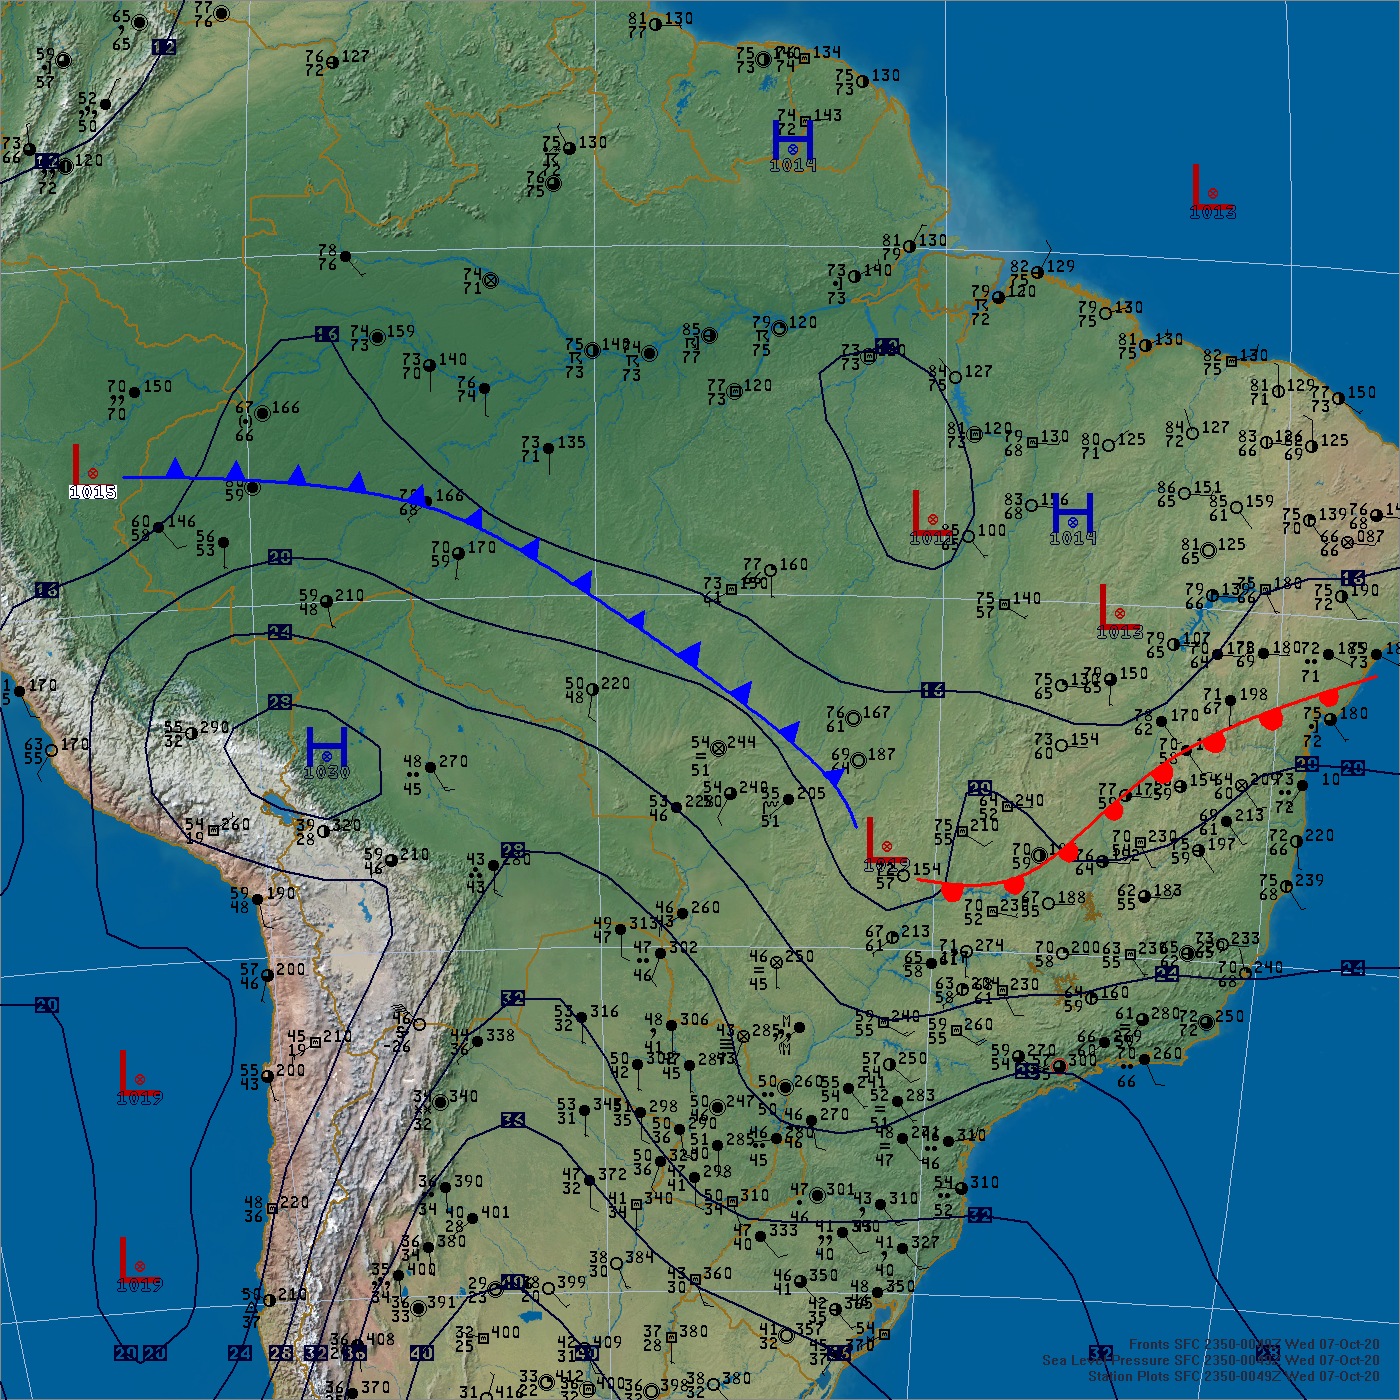
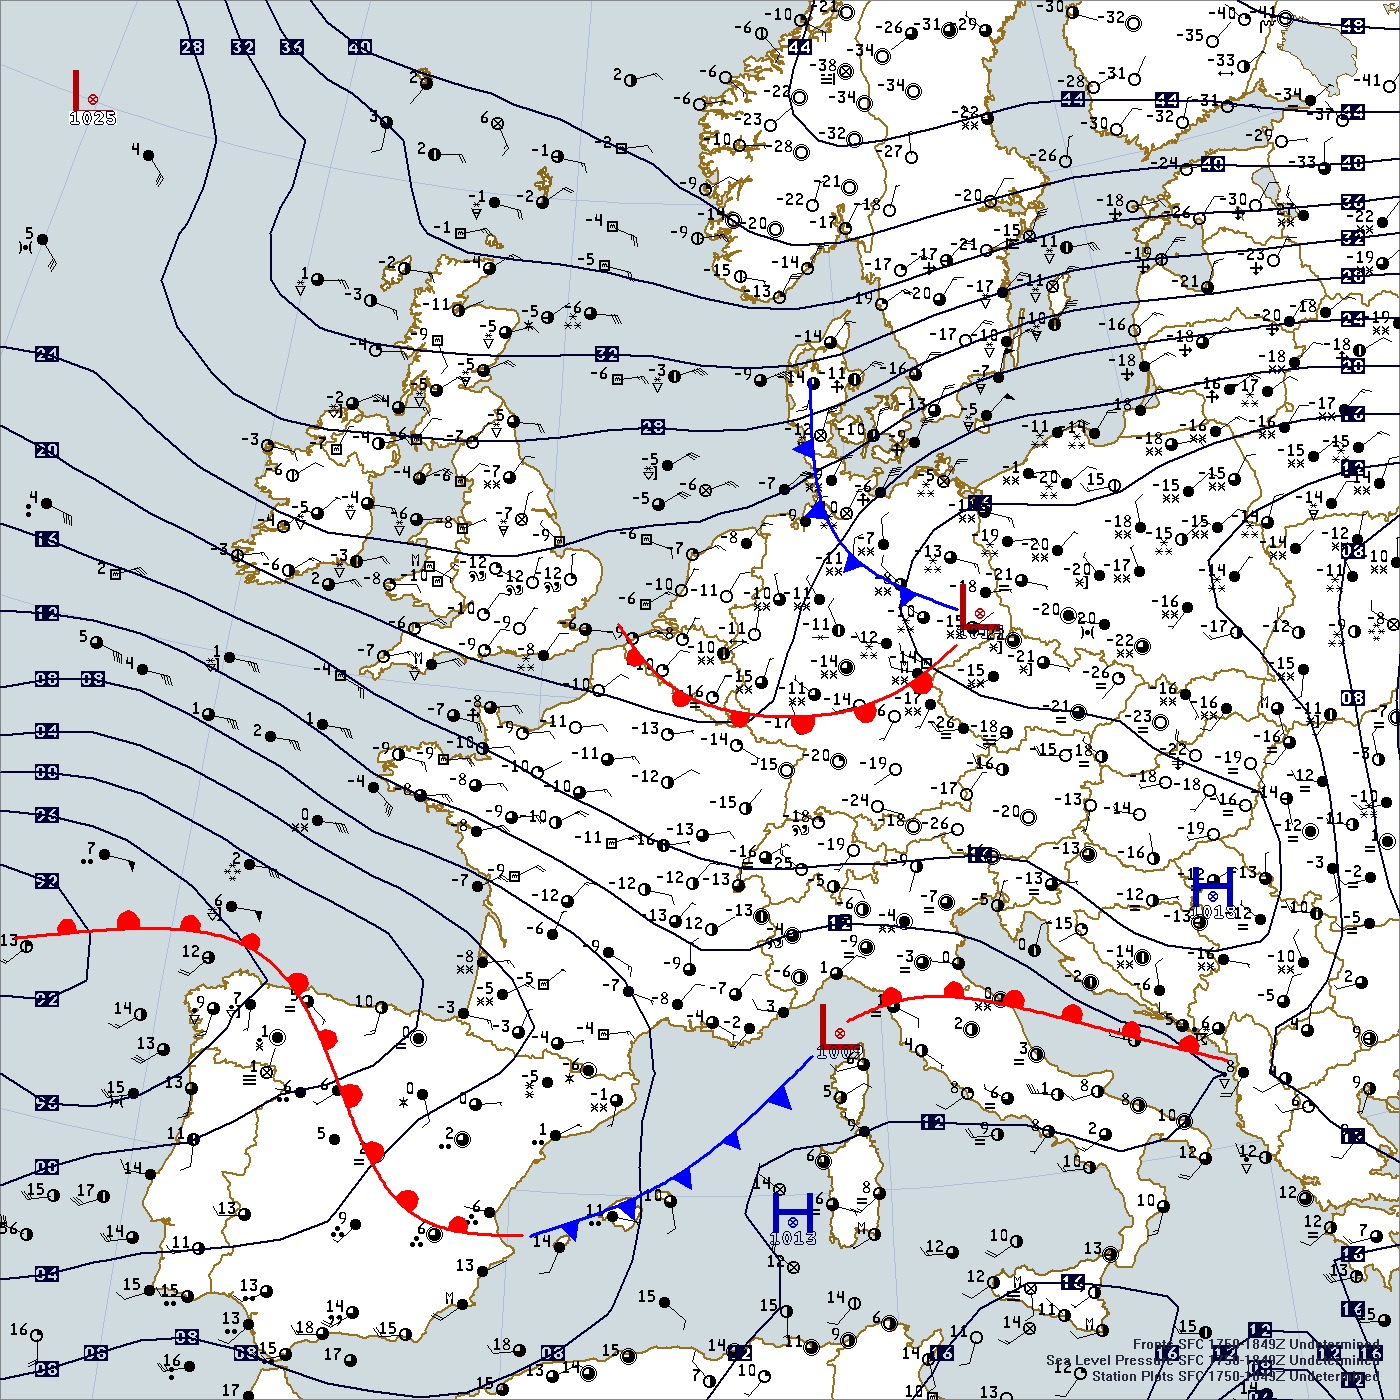
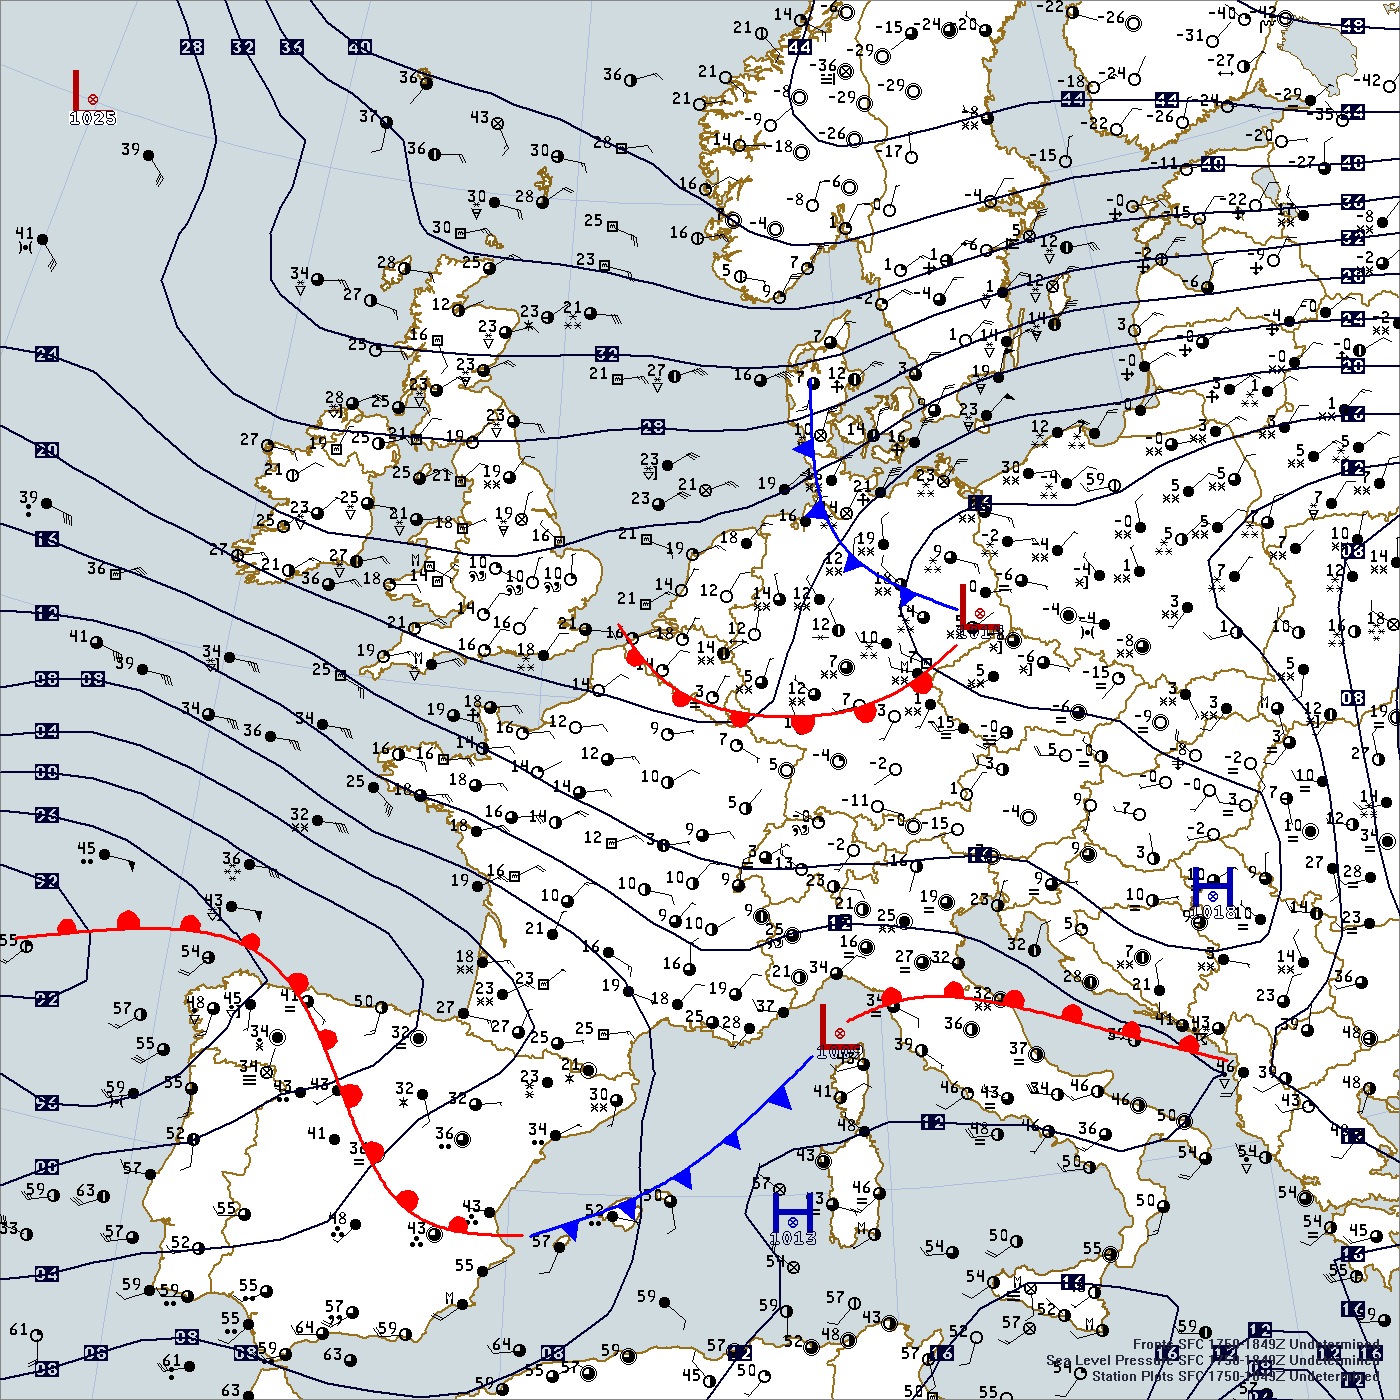
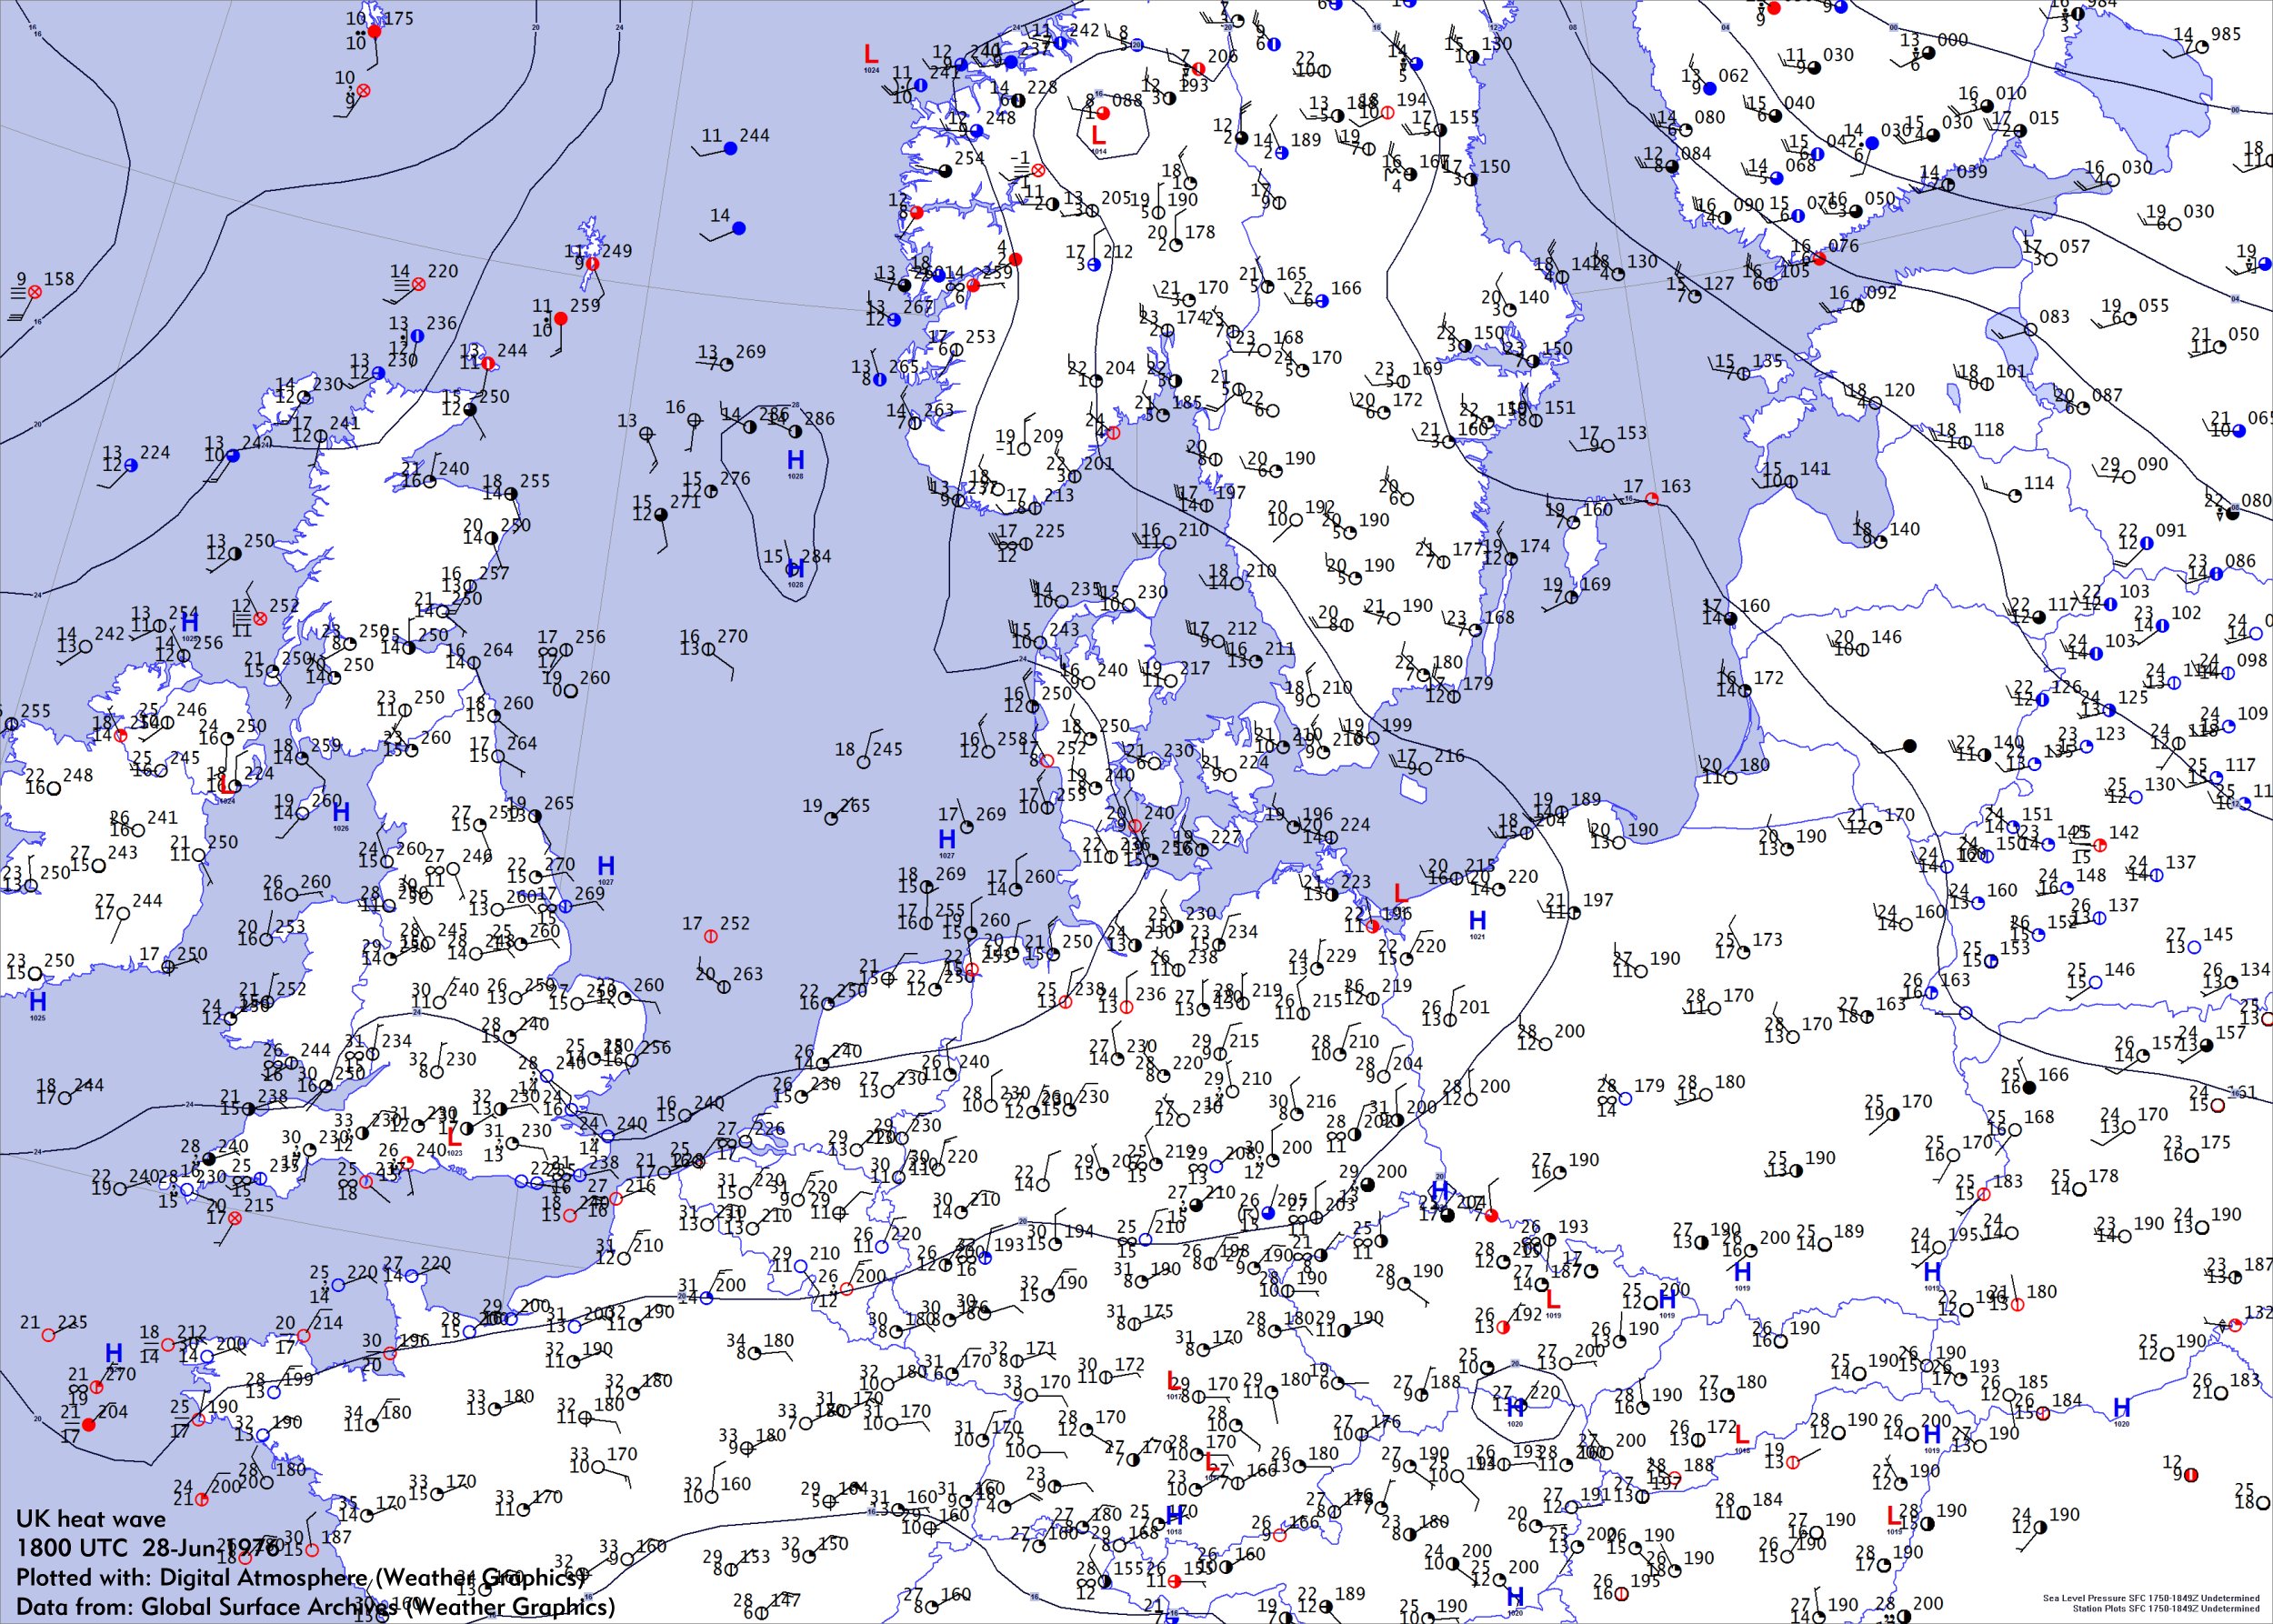
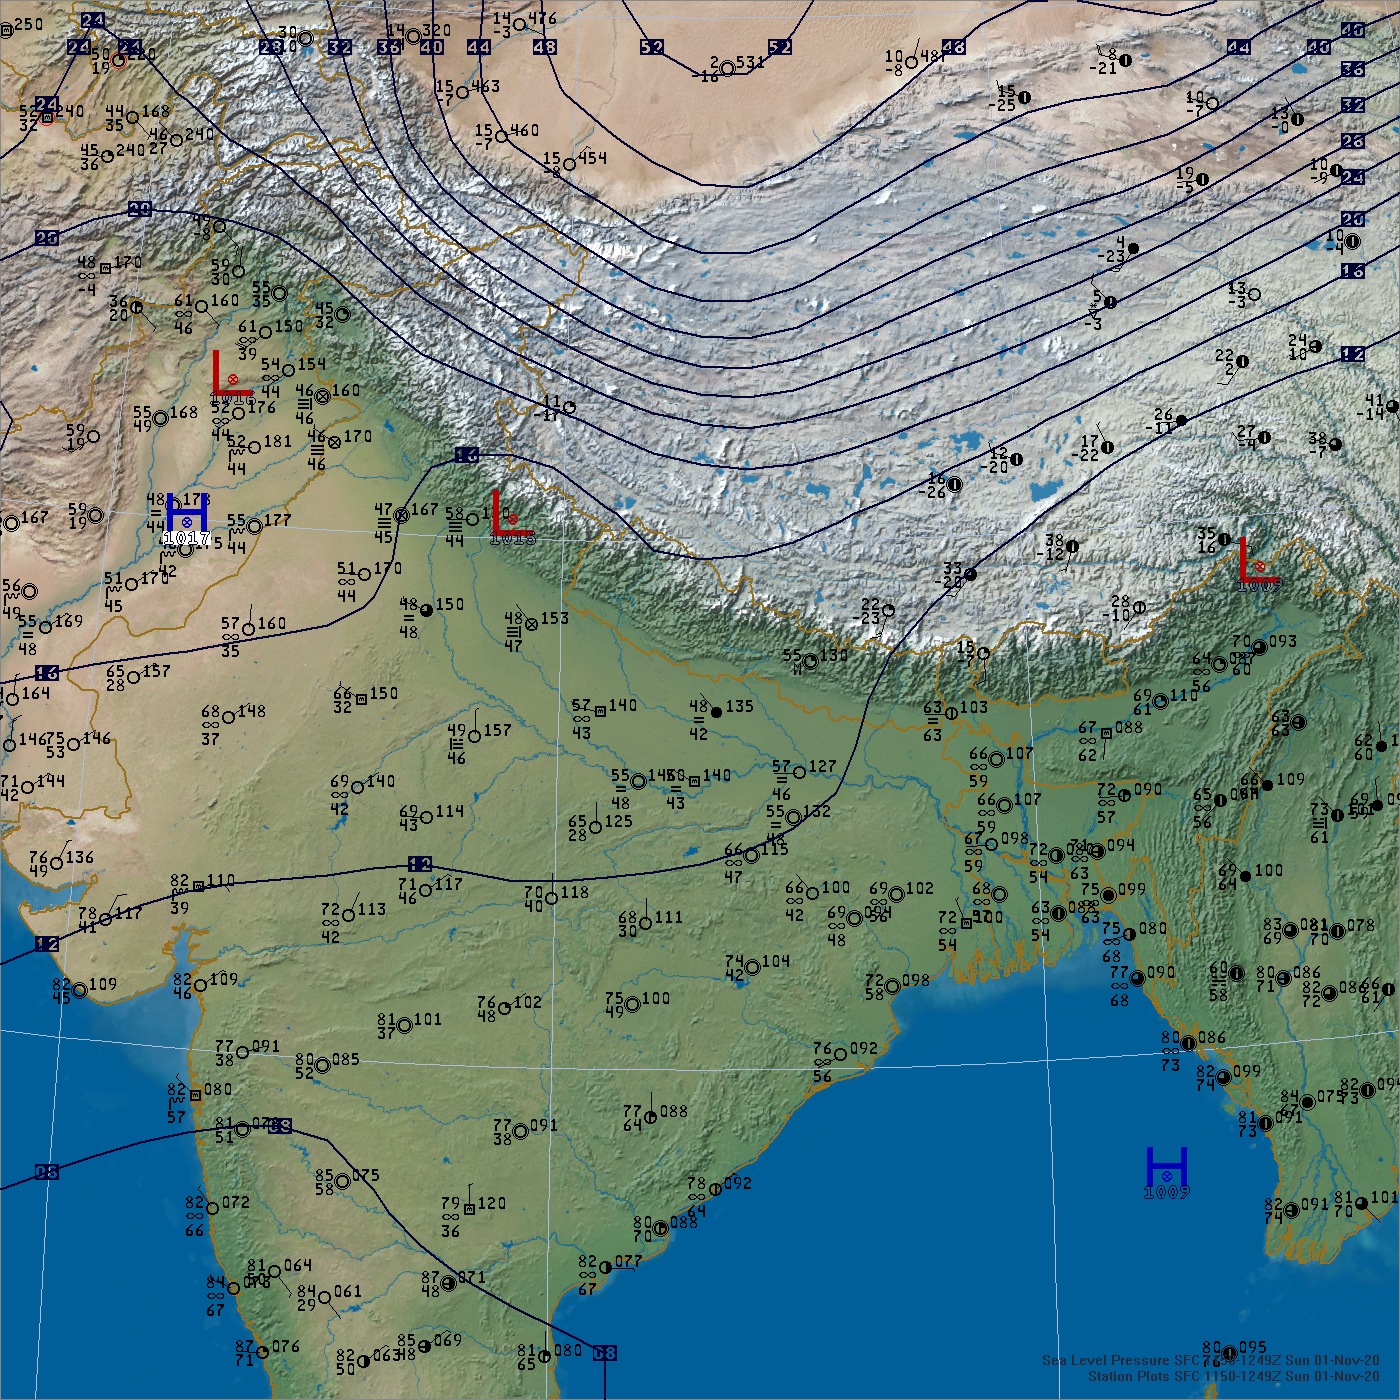
Maps plotted with Global Surface Archives
All of these map samples were generated with Digital Atmosphere. You can use other software such as GEMPAK and MetPy that handles METAR data.


