Malaysia Airlines Flight 370
Investigation of a possible southern arc contrail
by Tim Vasquez / Weather GraphicsMarch 18, 2014
* Update / 2014-03-19: The metadata for the 0100 UTC satellite frame shows it was collected between 0030 and 0100 UTC. Since the radiometer operates in spin scan mode, it is likely the suspect contrail was sensed at approximately 0050 UTC, which given the timeline below would be consistent with a speed of M.86-.87. Coincidentally the B777-200's MMo is M.87, so if any of this is correct it would be the fastest speed at which overspeed warnings would not go off. I also added a VIS/IR comparison below.
Also see:
* Main Malaysia Flight 370 page
* Indian Ocean visible zooms
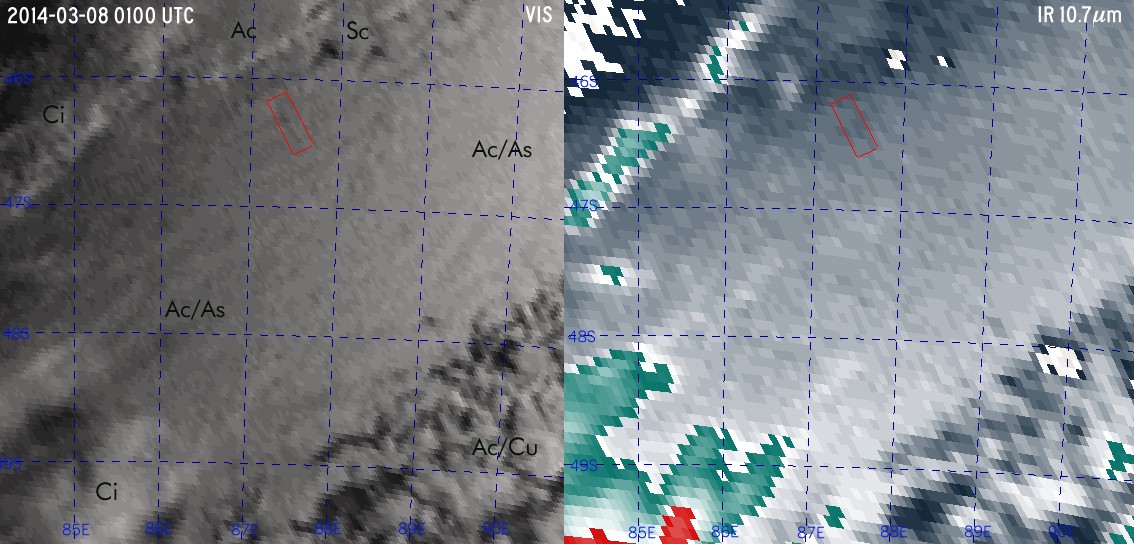
To date there has been a remarkable lack of data on the whereabouts of Malaysia Airlines Flight 370, which failed to arrive in Beijing after departing Kuala Lumpur on March 7-8. In an attempt to find contrails, on March 17, 2014 I posted numerous visible satellite sectors for the Indian Ocean, enhanced to compensate for the dim early morning conditions. It was thought that crowdsearching the images (as with Tomnod) would yield results, so I asked the PPRUNE community to examine them and provided some guidance as to what they should look like. Contrails are occasionally seen on high-resolution visible imagery (De Grand, et al, 2000; Carleton and Lamb, 1986, etc). They can be highly prominent in the early morning hours due to low sun elevations which create large shadows. One user on PPRUNE (Chicklets) found a signature that resembled a hairline contrail on the 0100 UTC image (7:00 am local time). After this was confirmed by other users (kayej1188, Turkey Brain, etc) I searched the image and located it (below; left is the feature without annotations, and right is with measurements).
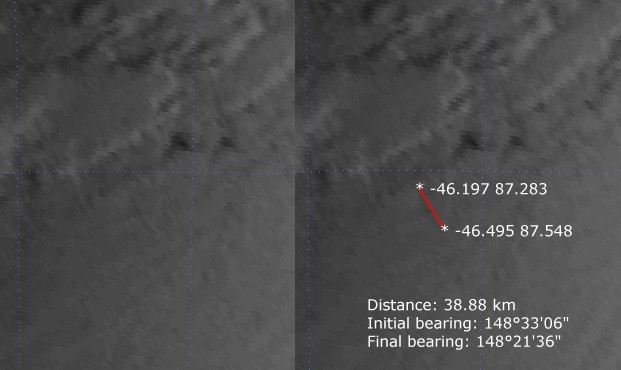
Analysis of the METEOSAT7 imagery showed that this signature does bear a close resemblance to a typical early morning cloud shadow from a contrail onto the top of a stratified lower middle cloud layer, which given the appearance of double layers and a slightly cold signature on the IR channels appears to be a low overcast altostratus or altocumulus later at about 5 to 10 thousand feet beneath an mid-level inversion. This is in a region with virtually no air traffic, and no published air routes within several hundred miles. It is inconclusive whether this feature is in fact a contrail, due to the limited resolution of the imagery at this slant angle and the low albedo at this early hour. Alternative explanations include noise in the data and transverse cirrus bands. However due to the linear structure it was decided to investigate further. The archived METEOSAT7 imagery was loaded into the McIDAS (University of Wisconsin / SSEC) viewing software and the coordinates of the feature were measured as (-46.197,87.283 ... -46.495,87.548), measuring 39 km in length and oriented at an angle of 148.5Ḟ relative to true north.
The GFS 8/0000 UTC analysis for 250 mb showed flight level winds across this area of 230Ḟ true at 110 kt. Assuming this contrail is representative of an aircraft track of 149Ḟ true (magnetic 196Ḟ) the aircraft would have had to assume a heading of 210Ḟ magnetic to fly a track of 196Ḟ magnetic, which would produce this contrail. Going from the hypothesis that the Boeing 777 autopilot was flown in heading mode of 210Ḟ with a normal heading reference without any change (possibly from pilot incapacitation or an intention to ditch the plane over open ocean), the flight track was backtracked in time. This backtrack fully compensates for magnetic declination and wind field changes, producing a curved and slightly uneven path. Surprisingly, this led back to the western Strait of Malacca region. The intent of a 210Ḟ heading is unknown and may fit into some of the suicide theories, as this initially points deep into the Indian Ocean and being highly oblique to the Indonesian island chain would be an optimal heading for "disappearing" the plane. The track shows a pronounced curve to the left near the end, owing to the effects of rapidly increasing magnetic declination (as much as 47ḞW at the contrail point) and drift due to a jet stream at 45ḞS.
In the table below we assume the aircraft flew westward and toward the Strait of Malacca as some of the Malaysian investigative reports indicate, and bypassed the 10ḞN waypoint shown in the image above, and that after some sort of altercation or change in plans on board a heading of 210Ḟ was selected, which would be 210ḞM, with heading reference in NORM as would be expected. This would then be engaged by putting the autopilot in heading mode in an attempt to fly out into the remote Indian Ocean. The first point in this set that would be crossed was at 5Ḟ00'N 95Ḟ22'E. Here we assume FL390 with airspeed of M.82 (TAS=468 kt).
|
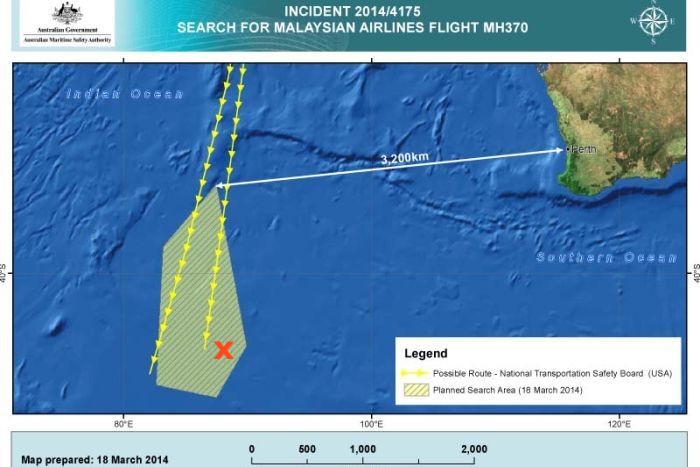
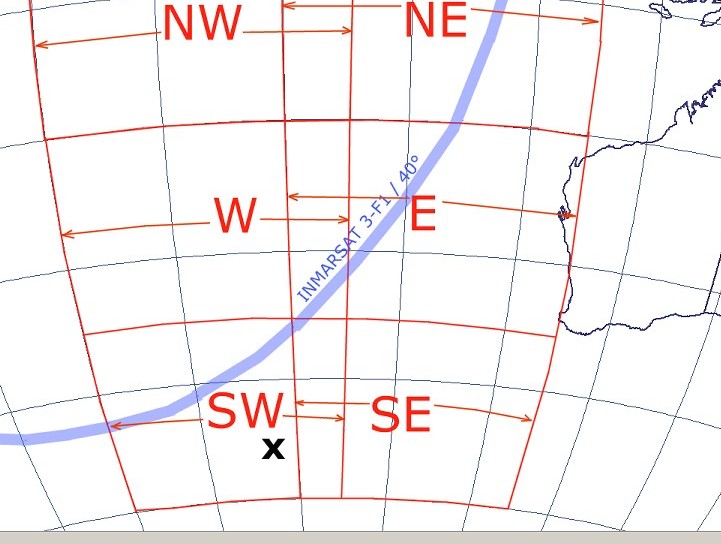
This would place the aircraft at the contrail location close to the image time. There may be errors from wind estimates, airspeed, and satellite scan line time. The "x" plotted on the map below is the location of this suspected contrail, and it falls precisely within the search area map released in the past day.
Below is the suspected contrail location relative to the INMARSAT 3-F1 40-degree arc. It should be remembered that the arc is an approximation determined by investigators based on signal analysis, and depending on the exact time the signal was acquired the plane could be in a slightly different location along the track.
(Updated 3/19/2014) Below is a comparison of the visible and infrared channels. There is a vague region along and up to about 20 nm east of the suspected contrail that faintly suggests the line is actually the back edge of a cirrus fragment. This appears to be ruled out by the infrared channel, which does not show any cold anomaly in this area. The feature therefore is most likely either a contrail or a spurious artifact in the data.
Whether the plane could carry enough fuel to reach this far is a bit outside my area of expertise. This could depend considerably on what exactly was loaded at Kuala Lumpur and whether the plane was carrying extra fuel to minimize fuel purchase requirements at Beijing (so the cost of JET-A at Kuala Lumpur vs. Beijing may factor into this). One experienced A330 pilot I talked with over E-mail (Don Hudson) suggested 9 hours endurance, and if takeoff time was at 1641 UTC this would suggest fuel exhaustion around 0140 UTC, which does not conflict with the data.
So summarize, this is somewhat hypothetical because there is insufficient resolution and signal quality to determine for sure whether the feature in the image is in fact a contrail, and it could very well be spurious noise in the satellite signal. However if we assume that it is a valid contrail feature, there is a remarkable degree of correlation in all the data. Assuming it is valid, pinpointing the exact location of downing would also require correction of the shadow (~10000' AGL) to flight level (~40,000' AGL) with respect to sun elevation, placing it about 15-25 nm east of the shadow, and would require extrapolation along 210ḞM (correcting for wind drift) to the presumed point of fuel exhaustion. Given the highly limited availability of remote sensing data in this area and lack of any other data, this signature deserves closer investigation.
Tim Vasquez is a meteorologist and owner of Weather Graphics in Norman, Oklahoma. He served as an aviation weather forecaster in the U.S. Air Force for 10 years before moving into meteorological programming and consulting. He has written 7 forecasting textbooks to date and is a columnist for Weatherwise and IFR magazines.
© 2014 Weather Graphics