Malaysia Airlines Flight 370
Meteorological and oceanographic images for the Southeast Indian Ocean
Also see:
* Main Malaysia Flight 370 page
* Analysis of a suspected contrail in South Indian Ocean (initially posted March 18)
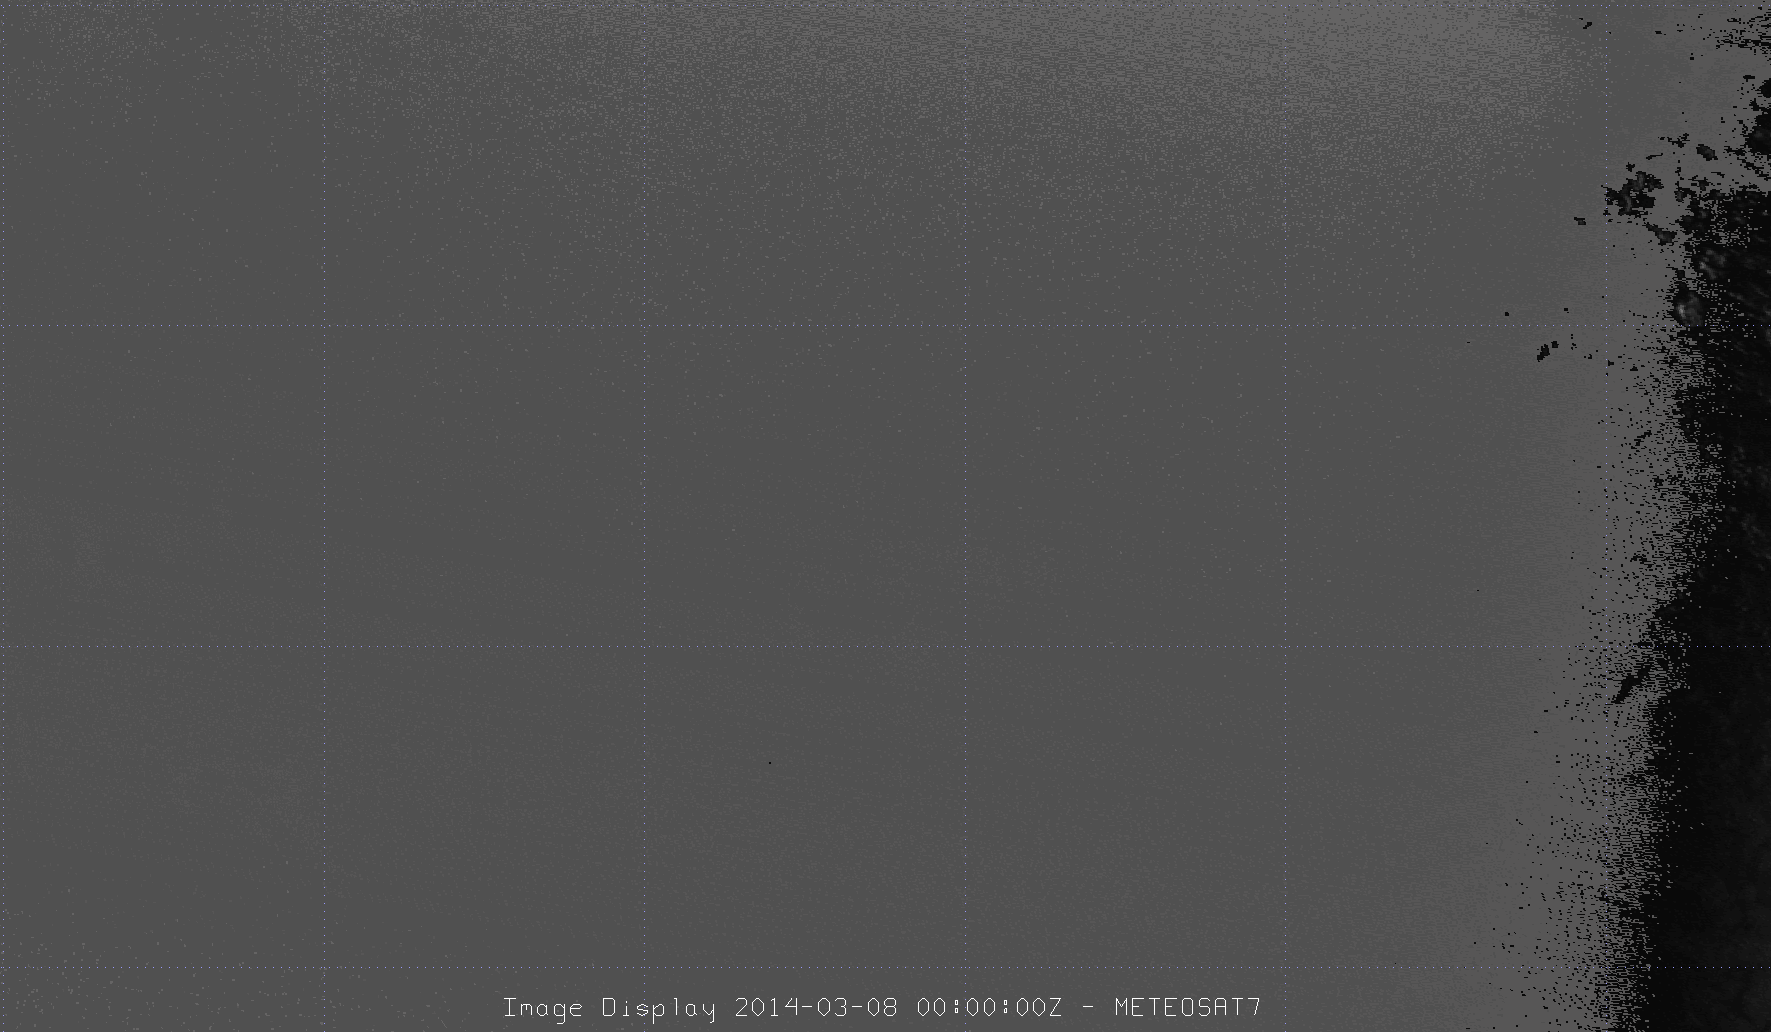
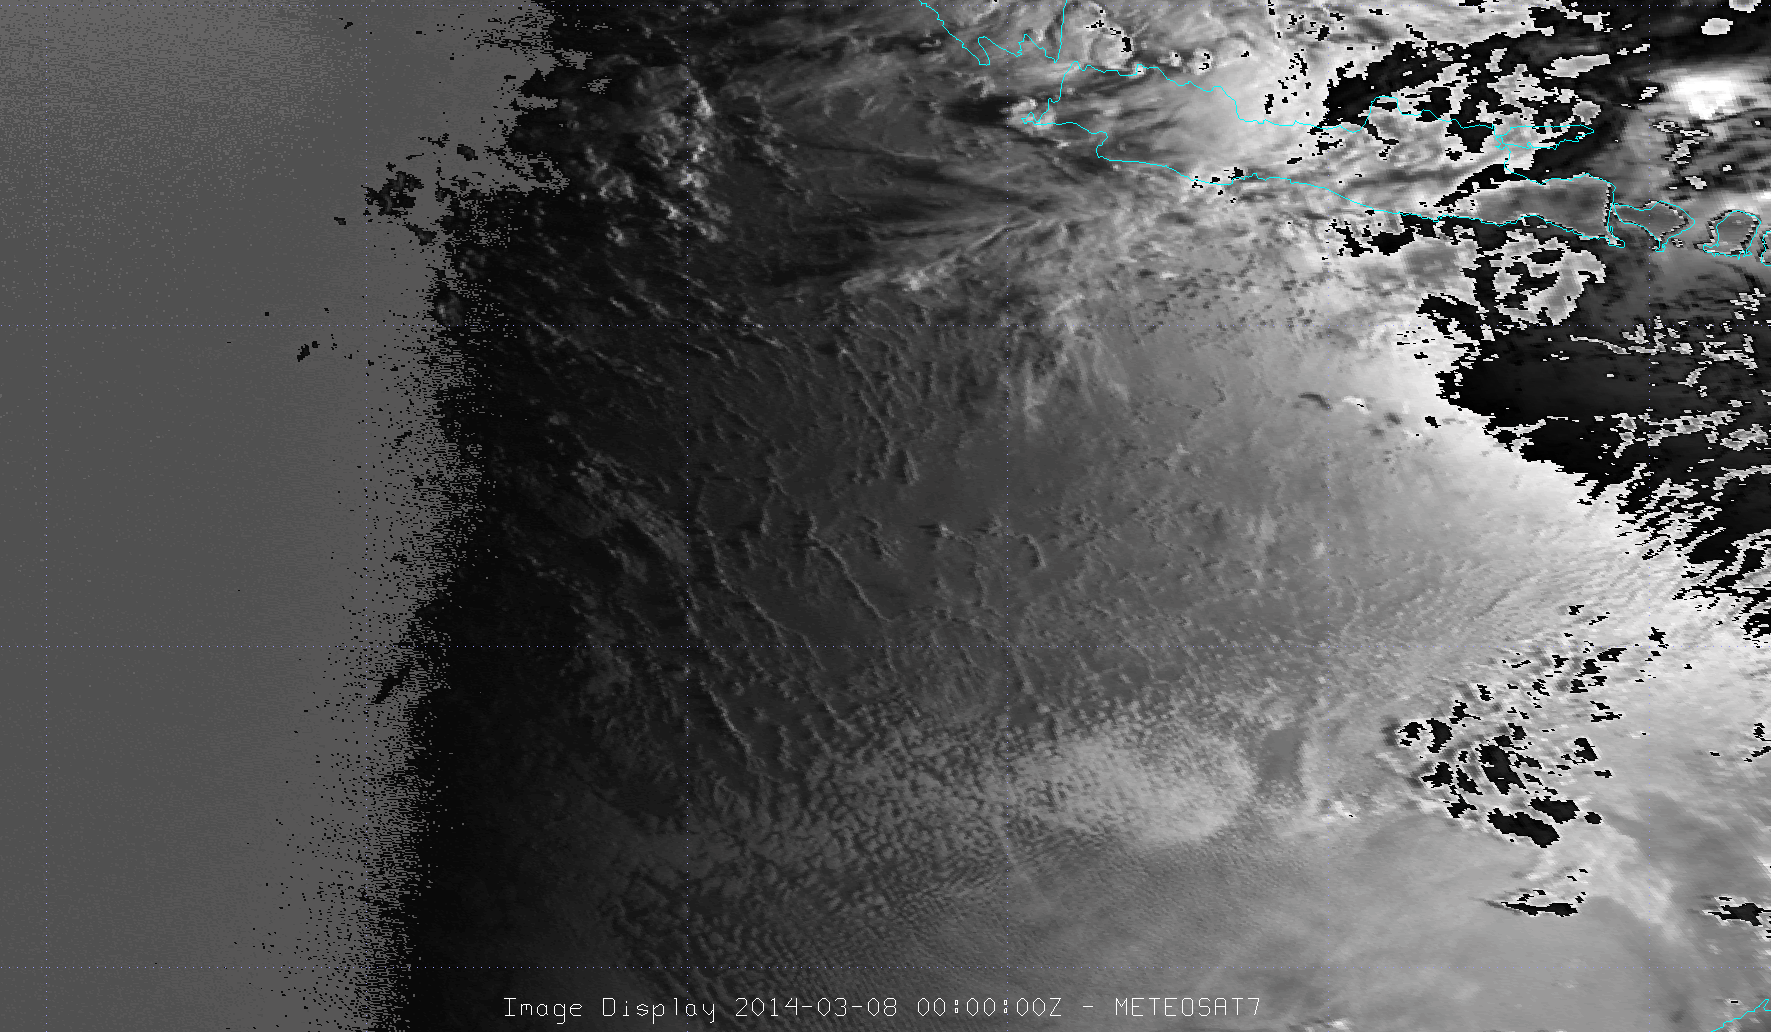
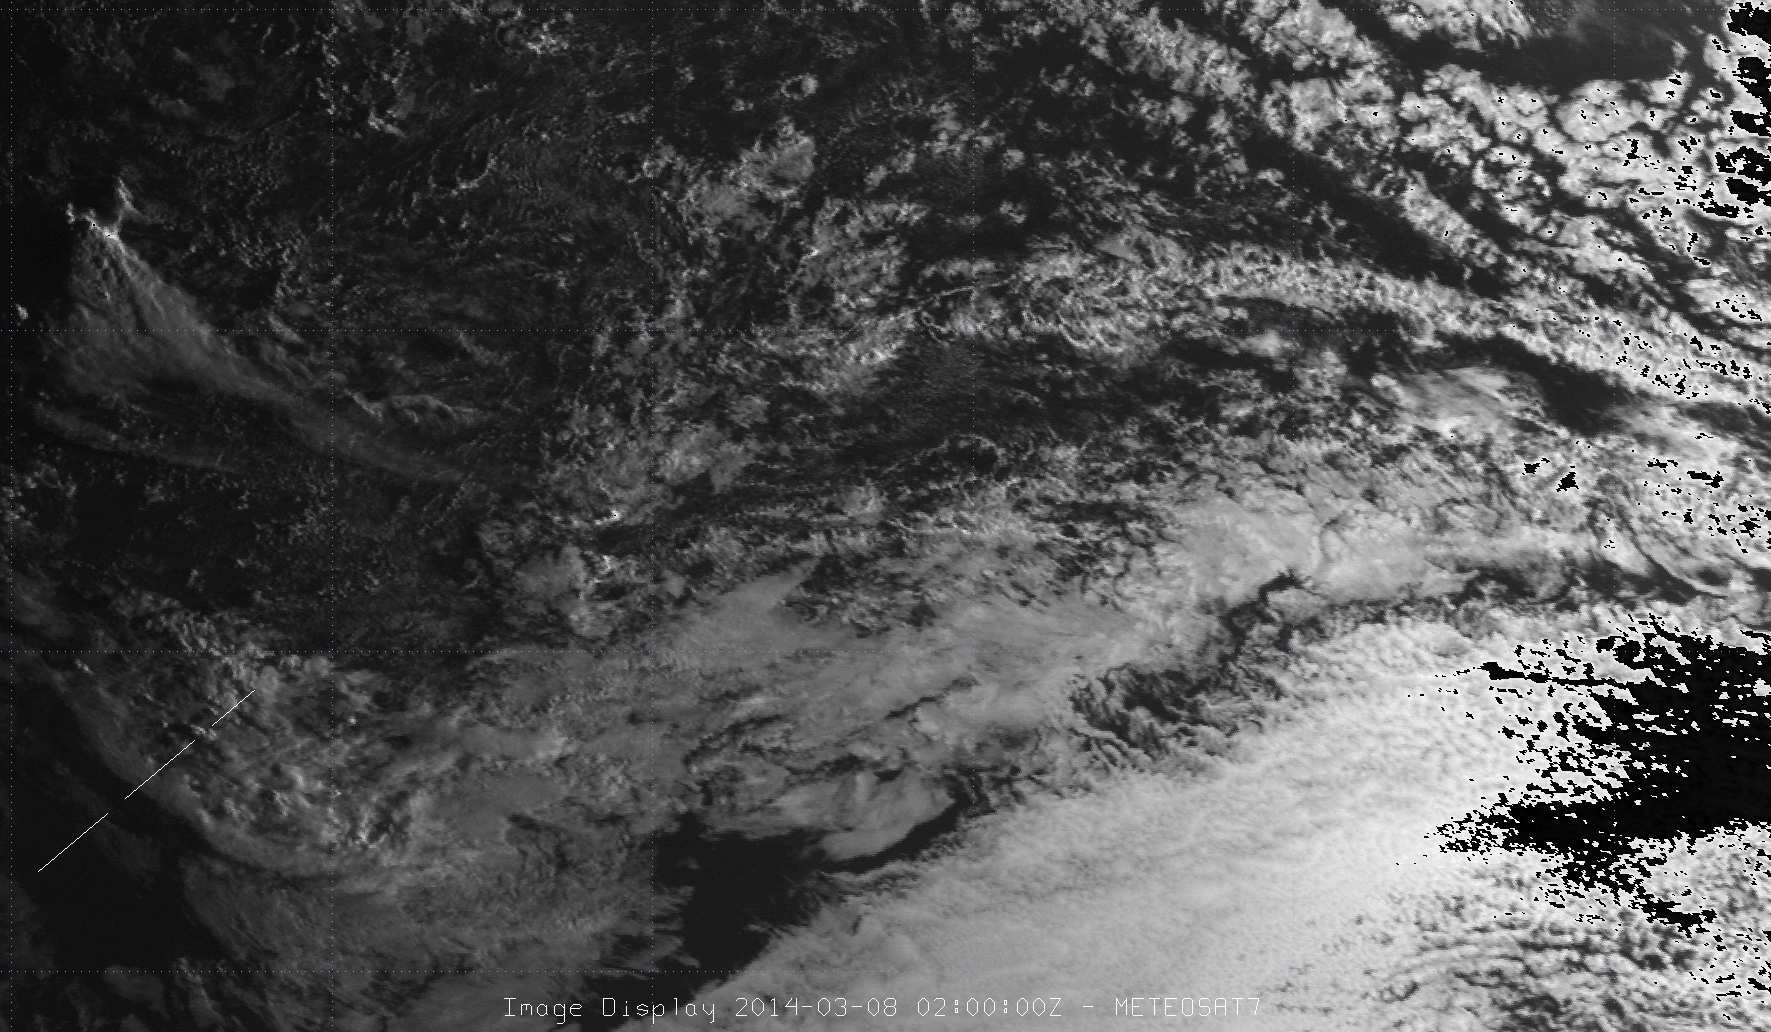
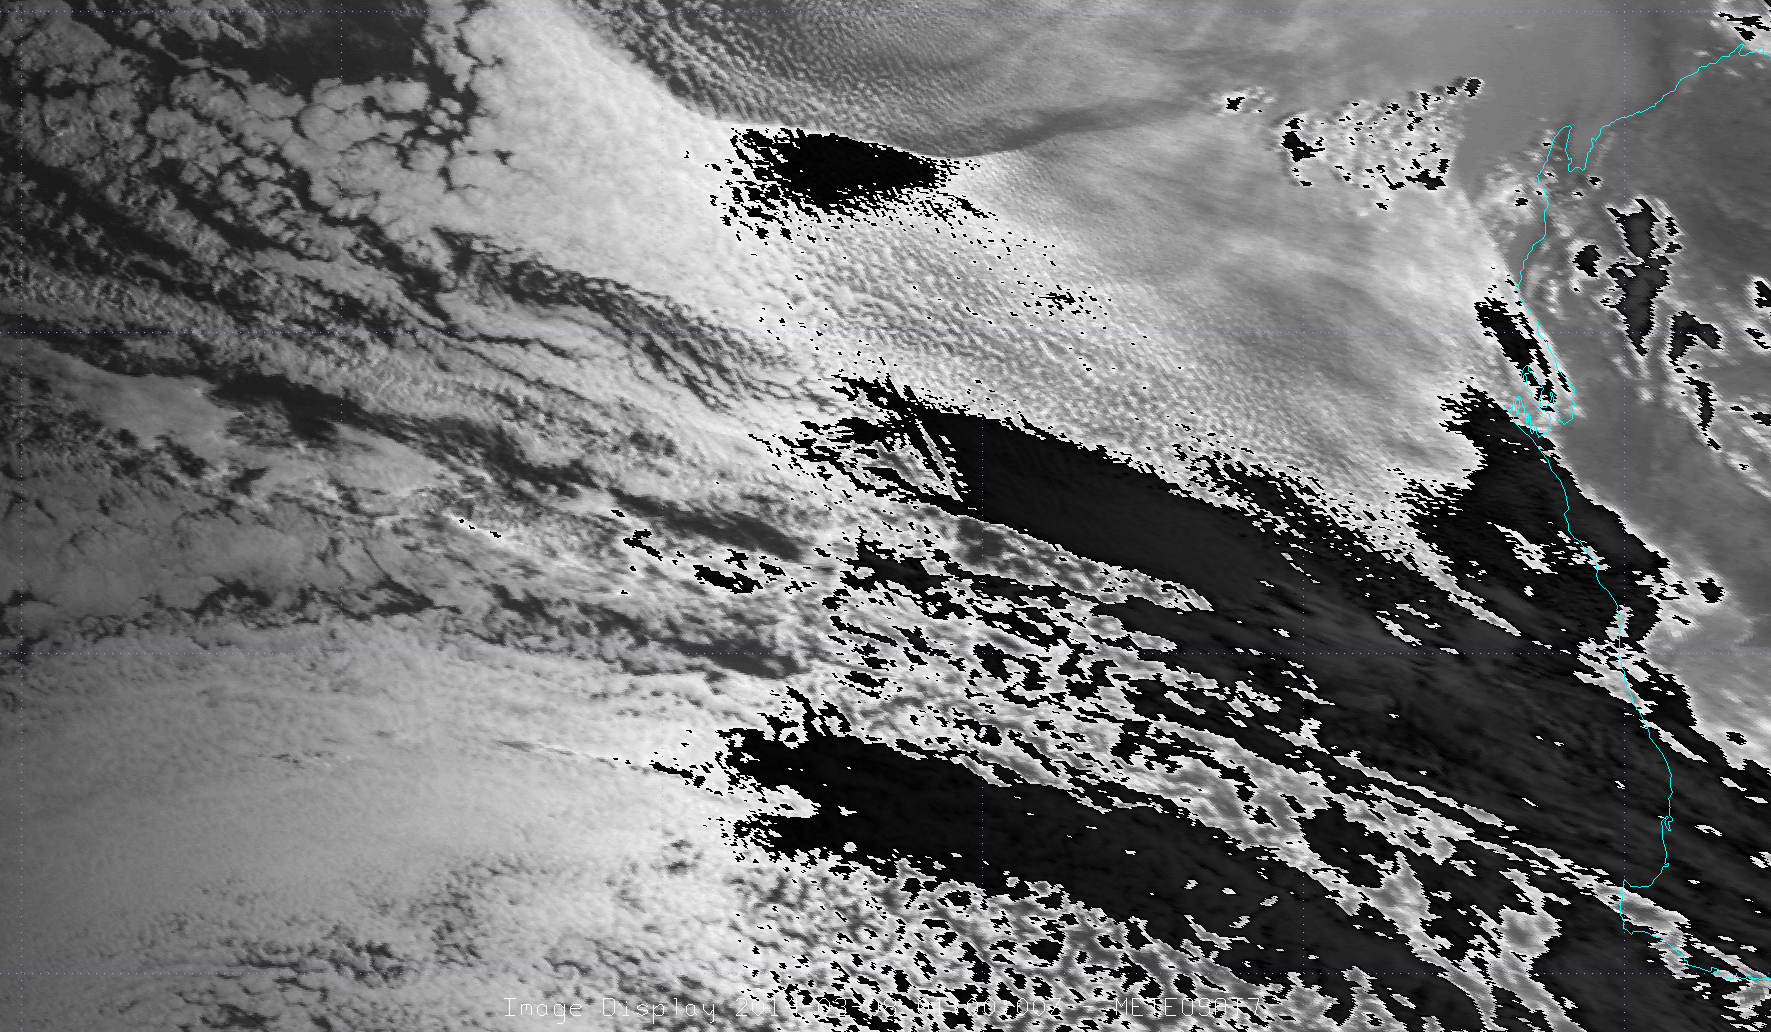
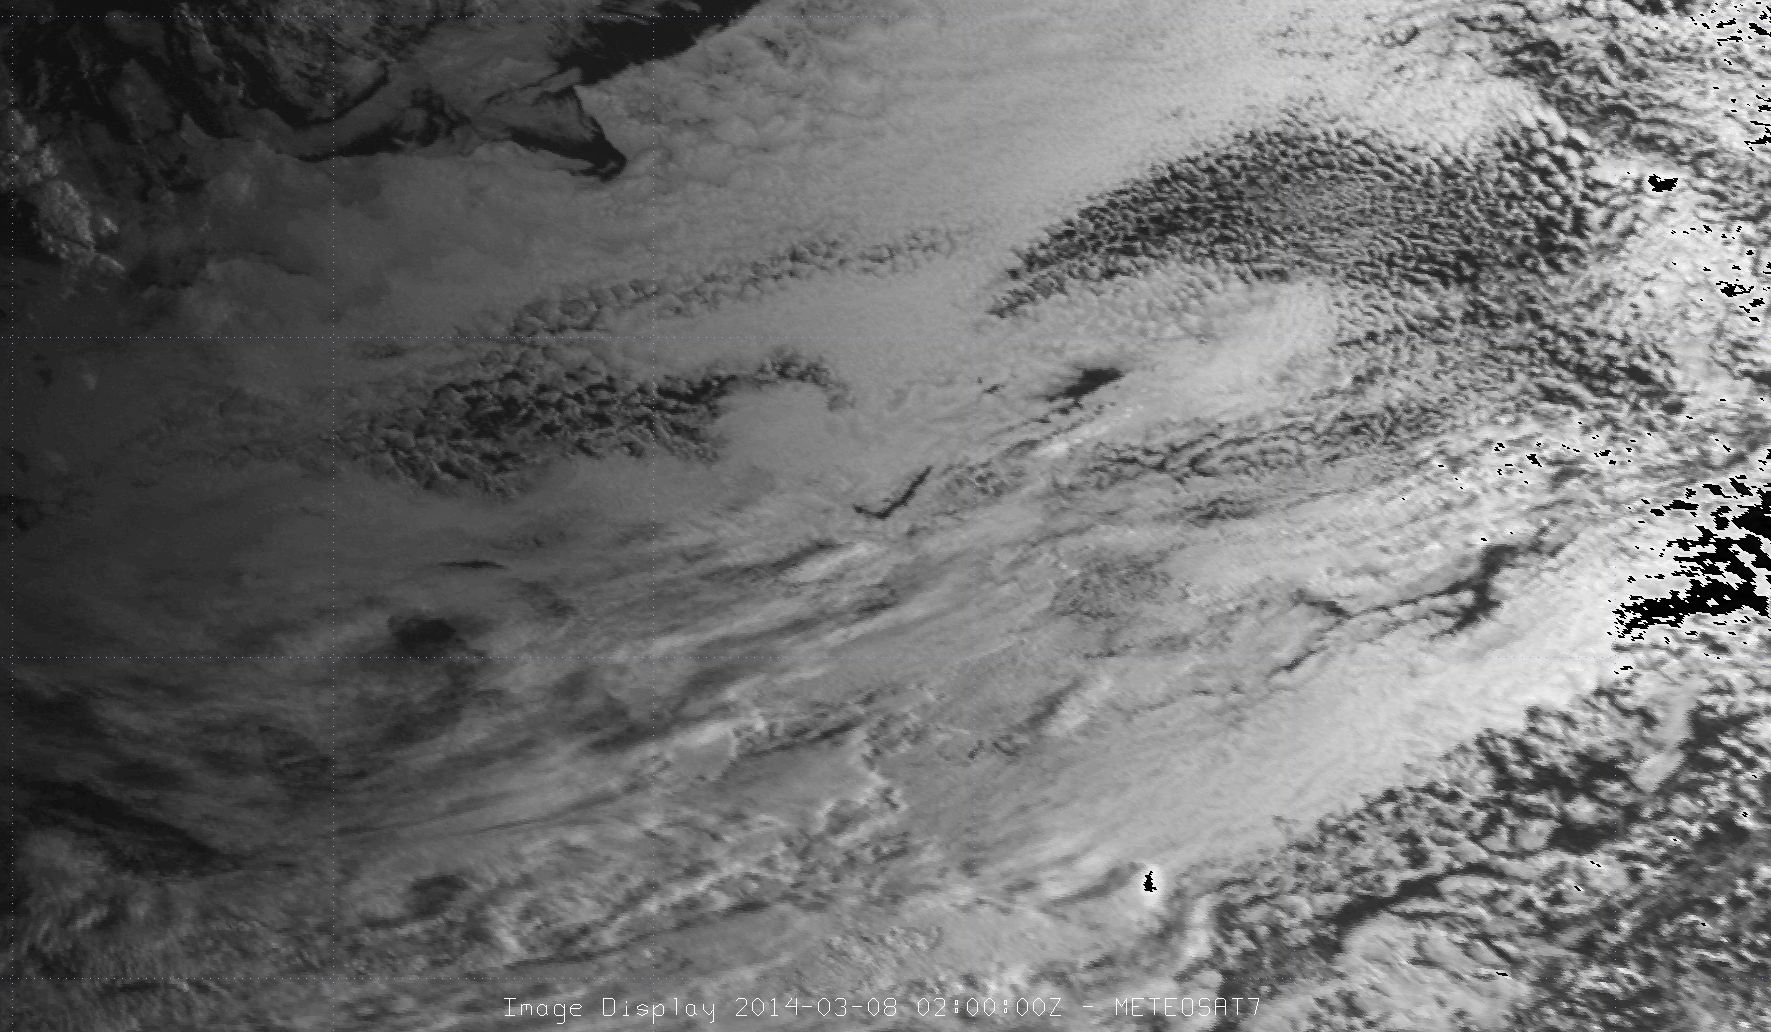
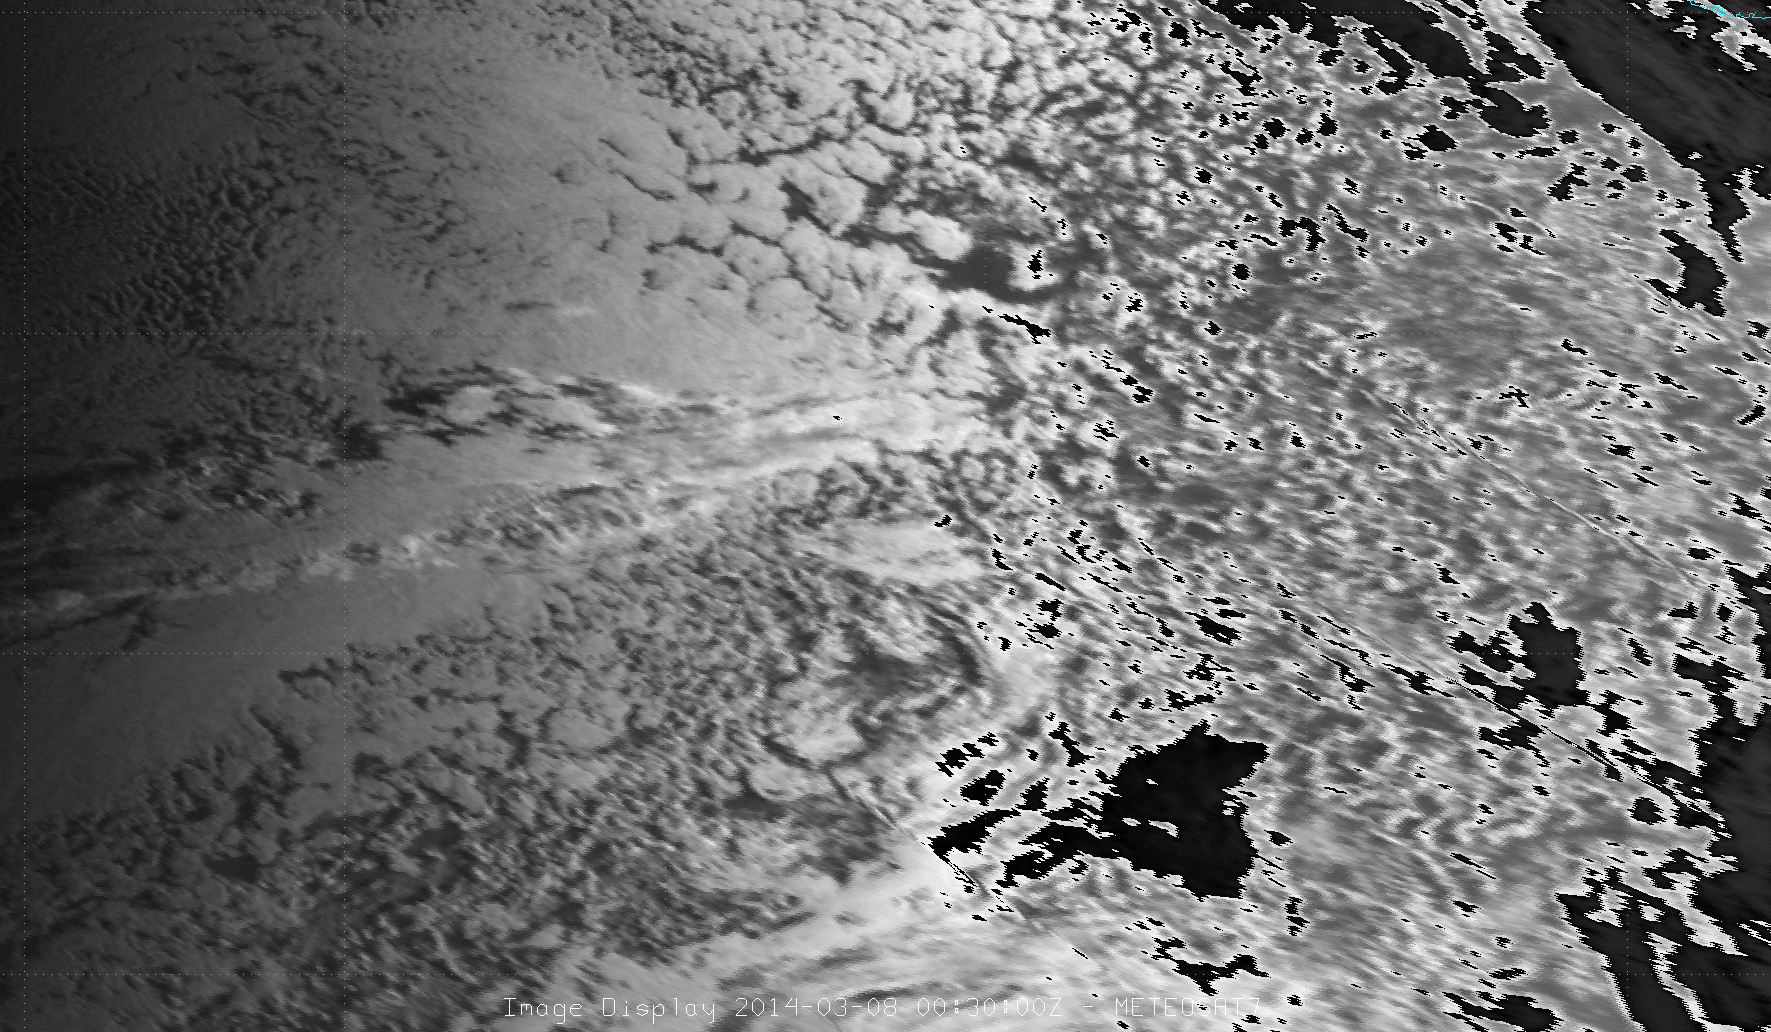
These visible images are from METEOSAT 7 and are provided as-is. Resolution is 2 km, so these will be barely able to discern a contrail, if at all. Note that this does not mean a contrail has to be 2 km wide, but must either have very strong albedo or a strong shadow (producing sharp visual contrast). If the layer is nearly saturated it is also capable of generating a persistent cirriform layer that grows significantly.
Any contrails will look like hairlines and in most cases will only be visible against the ocean. Contrails above cloud layers are usually signified by hairline shadows, with the contrail itself invisible. North-south contrail shadows are prominent during the first hour of daylight when the slant angle of the sun diffuses the contrail across large distances. During these hours the gap between shadow and contrail may be up to 10-20 pixels (compare with the shadowing on the cirrus clouds in the southern sectors).
The downside is that much of this air mass is dry and subsident. Do not expect to find a contrail; this is just one possible avenue of last resort given the current status of the investigation and it is very possible these images will provide no definitive leads. This is just a tool of last resort.
The images use a special enhancement curve to bring out signatures in the early dawn low-light conditions. Areas of absolute darkness appear as gray. Areas of weak illumination are painted in a normal black-to-white spectrum. Areas of bright illumination are painted black again with a new grayscale starting, and since they correspond to cloud areas they will probably not have contrail signatures.
I apologize that the grid lines are not labeled; this is a limitation of the display software, but from the coordinates provided here for each grid you should be able to determine this. The images have also been projected to a rectangular grid to allow for easy measurement of latitude/longitude.

Northwest region
Latitude: S5 to S20, grid every 5 degLongitude: E70 to E95, grid every 5 deg
* 0000 UTC
* 0030 UTC
* 0100 UTC
* 0130 UTC
* 0200 UTC
* Animated GIF (4 MB, allow time to load)
Northeast region
Latitude: S5 to S20, grid every 5 degLongitude: E90 to E115, grid every 5 deg
* 0000 UTC
* 0030 UTC
* 0100 UTC
* 0130 UTC
* 0200 UTC
* Animated GIF (25 MB, allow time to load)
West region
Latitude: S20 to S35, grid every 5 degLongitude: E70 to E95, grid every 5 deg
* 0000 UTC
* 0030 UTC
* 0100 UTC
* 0130 UTC
* 0200 UTC
* Animated GIF (8 MB, allow time to load)
East region
Latitude: S20 to S35, grid every 5 degLongitude: E90 to E115, grid every 5 deg
* 0000 UTC
* 0030 UTC
* 0100 UTC
* 0130 UTC
* 0200 UTC
* Animated GIF (20 MB, allow time to load)
Southwest region
Latitude: S35 to S50, grid every 5 degLongitude: E70 to E95, grid every 5 deg
* 0000 UTC
* 0030 UTC
* 0100 UTC
* 0130 UTC
* 0200 UTC
* Animated GIF (11 MB, allow time to load)
Southeast region
Latitude: S35 to S50, grid every 5 degLongitude: E90 to E115, grid every 5 deg
* 0000 UTC
* 0030 UTC
* 0100 UTC
* 0130 UTC
* 0200 UTC
* Animated GIF (16 MB, allow time to load)
What does a contrail look like?

Contrails also occur only within a specific range of conditions: those that are cold (i.e. high) and/or humid. No radiosondes were available in the eastern Indian Ocean but we can use the one for Learmonth, WA, Australia which is nearby and fairly representative. This indicates the plane would have had to been above the FL350-390 range to be visible, depending on humidity. Any extended flight at FL450 should be fully visible.

Surface conditions and satellite sectors for 0000 UTC. The overlay of the 40° INMARSAT 3-F1 arc is shown in blue, suggesting an approximate location for the plane at 0011 UTC assuming it flew south of the Equator.

Tim Vasquez is a meteorologist and owner of Weather Graphics in Norman, Oklahoma. He served as an aviation weather forecaster in the U.S. Air Force for 10 years before moving into meteorological programming and consulting. He has written 7 forecasting textbooks to date and is a columnist for Weatherwise and IFR magazines.
© 2014 Weather Graphics