


WX-SIM is a desktop meteorological forecasting model
developed over a span of 25 years by Tom Ehrensperger, a teacher in Atlanta who holds an M.S. in physics.
It is a dynamic forecast model operating at one location, forecasting the weather for that spot.
WX-SIM exploits observed conditions and centralized forecast data from NOAA and combines it with its own
sophisticated physics model of the local atmosphere.
The result? A singularly accurate forecast for the location of your choice.
This makes it the tool of choice for the agricultural industry, aviation forecasters, and sporting venues.
To try out a fully working copy of WX-SIM (runs Atlanta, Georgia only) click here:
wxsimdemo.exe (Windows)
Sample images


NOTE: This graphic is NOT created with WXSIM and is only shown here for comparison purposes.

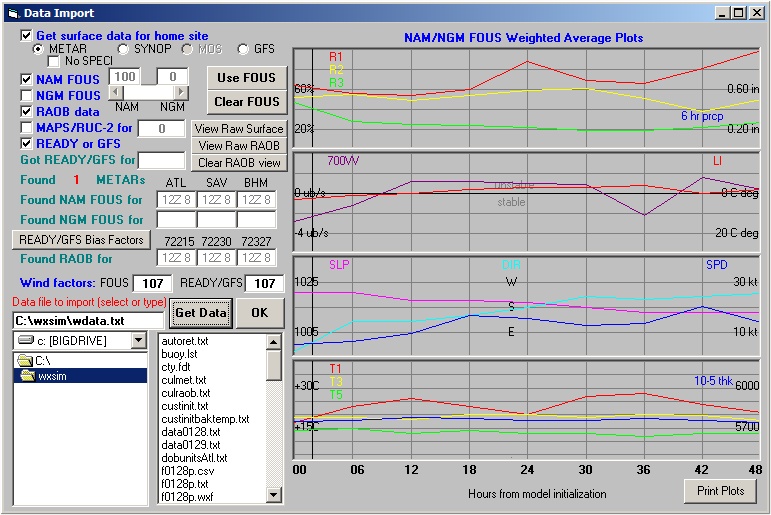


The interrupt planner takes advantage of free, automatically (through WXSIMATE) downloaded GFS data out to 180 hours. This nowĀeven includes use of GFS forecast data for advection after wind shifts that occurĀat any time during the forecast run.Ā This means model data to support WXSIM is available worldwide, out to at least a week.Ā Most people run forecasts between 4 and 7 days.

|
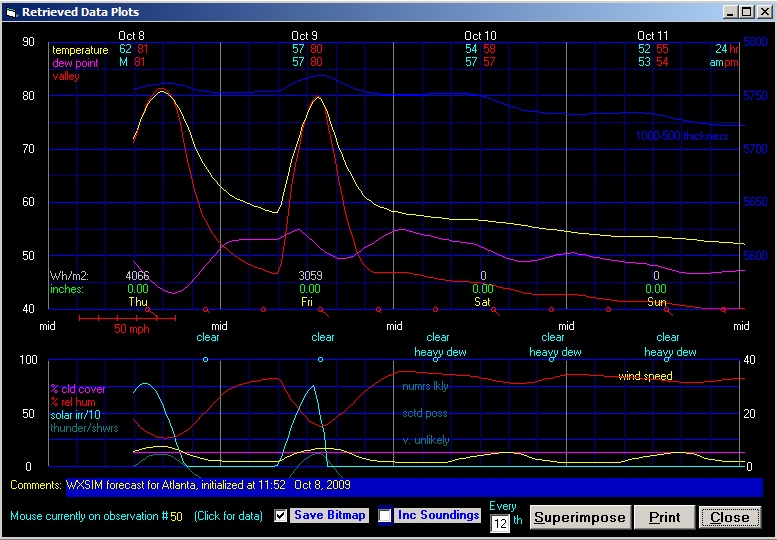
WXSIM text forecast for Atlanta, initialized at 11:52 Oct 8, 2009 _______________________________________________________________________________ This afternoon: Partly cloudy. High 82. UV index up to 6. Wind southeast around 7 mph. Tonight: Partly cloudy. Low 62. Wind southeast around 7 mph in the evening, becoming 11 mph after midnight. Friday: Mostly cloudy. High 84. Wind southeast around 12 mph. Friday night: Mostly cloudy to cloudy in the evening, becoming cloudy after midnight. A slight chance of rain. Low 68. Wind southeast around 11 mph in the evening, becoming 14 mph after midnight. Chance of precipitation less than 20 percent. Precipitation mostly less than a tenth of an inch. |
|
ZONE FORECASTS FOR NORTH AND CENTRAL GEORGIA...UPDATED NATIONAL WEATHER SERVICE PEACHTREE CITY GA 915 AM EDT THU OCT 8 2009 GAZ021-022-032>034-044>046-055-057-090015- CHEROKEE-CLAYTON-COBB-DEKALB-FORSYTH-GWINNETT-HENRY-NORTH FULTON- ROCKDALE-SOUTH FULTON- INCLUDING THE CITIES OF...ATLANTA...CONYERS...DECATUR... EAST POINT...LAWRENCEVILLE...MARIETTA 915 AM EDT THU OCT 8 2009 .TODAY...MOSTLY SUNNY. HIGHS IN THE UPPER 70S. SOUTHEAST WINDS 5 TO 15 MPH. .TONIGHT...MOSTLY CLOUDY. LOWS IN THE LOWER 60S. LIGHT AND VARIABLE WINDS. .FRIDAY...PARTLY SUNNY WITH A SLIGHT CHANCE OF SHOWERS AND THUNDERSTORMS IN THE AFTERNOON. HIGHS IN THE MID 80S. SOUTHWEST WINDS 10 TO 15 MPH. CHANCE OF RAIN 20 PERCENT. .FRIDAY NIGHT...MOSTLY CLOUDY WITH A SLIGHT CHANCE OF SHOWERS AND THUNDERSTORMS IN THE EVENING...THEN A CHANCE OF SHOWERS AND A SLIGHT CHANCE OF THUNDERSTORMS AFTER MIDNIGHT. LOWS IN THE MID 60S. SOUTHWEST WINDS UP TO 10 MPH. CHANCE OF RAIN 30 PERCENT. |
For those wondering, Atlanta reached 80 degrees this afternoon. WX-SIM correctly anticipated slightly warm temperatures, and that with just a bare minimum of setup and without any gridded model data for this particular run.
Chase mode
When you start in Chase Mode, a random day appears on your screen. You are presented with
the full spectrum of 1200 UTC (morning) charts, including mesoscale surface
maps, soundings, NCEP upper air plots, radar, and satellite imagery. There are also SPC
diagnostic products, and, if you wish, a chart of SPC risk areas, watches, and warnings.
You can send any chart to your printer to do a hand analysis.
After you've perused the charts, you need to pick a base city for your chasemobile
from one of 12 major cities. Then start it on its way towards the target!
When you're ready, advance hour by hour and watch all the charts change. Your
target might shift. Don't forget to adjust the position of the chasemobile!
It can be a tricky decision, because you can't move it more than 50 miles each hour.
As severe weather unfolds, you'll see reports stream in from locations close to
your chasemobile. A karma rating keeps track of how good or disappointing your
chase is doing, comparing your own success and what's going on just over the horizon.
At 0200 UTC (9 pm CDT) the game ends and your chase is scored.
The date is revealed and a summary of any of the day's events is presented.
How did you do?
Fortunately, you can try again! There are hundreds of other scenarios available!


Frequently asked questions
Can I run WX-SIM for any location on Earth?
No, at least not at this time. This is a technical limitation since Tom Ehrensperger customizes each weather site by hand, using climatology, vegetation, and topography. If you move and need to run WX-SIM for another location, you can order a new configuration package for a fraction of the purchase price.Why is WX-SIM useful if the centralized forecast models already give us hour-by-hour forecasts?
The centralized models only give one solution. There's no way of making adjustments to the conditions based on your own knowledge and intuition and tweaking the forecast. Not only does WX-SIM allow this interactive control but it also uses its own physics model of the atmosphere at your site to provide a more precise look at the forecast weather.In what niche is WX-SIM most accurate?
If used strictly by itself, WX-SIM is most accurate during the 0 to 12 hour time frame. During this time the centralized models are still resolving the noise in the initialized fields, which does not smooth out for a number of hours, and since WX-SIM has a highly accurate picture of current conditions it can use this to produce a very accurate forecast. Beyond 12 to 24 hours centralized models have a much greater grasp on the large-scale weather patterns, but WX-SIM exploits this data to take into account localized effects and microclimatology specific to your location. Another example is that it models special weather and phenomena. If the temperature is at a critical level for a planned weather event and an eclipse is expected, you can either hope that the centralized models are considering the small temperature drop with the eclipse, or you can run WX-SIM and find out for sure.What is this internal physics model?
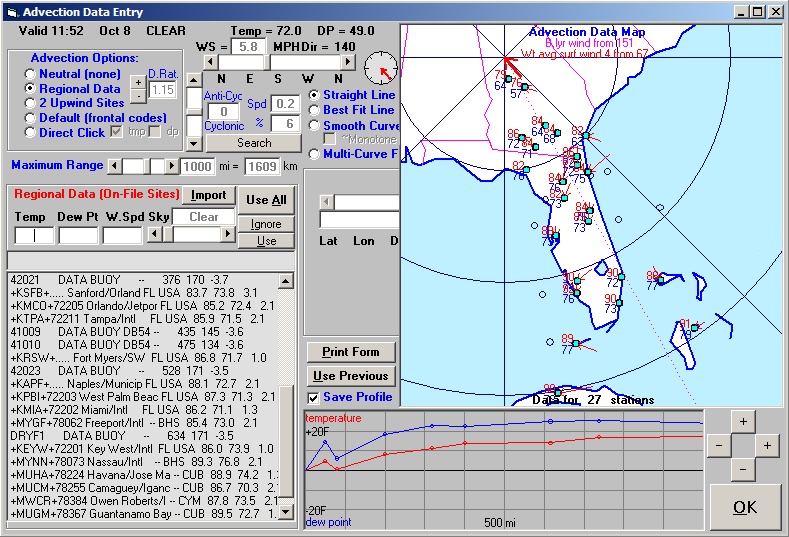
The internal physics model in WX-SIM looks at the incoming short-wave radiation, the outgoing long-wave radiation, the angle of the sun, and the various cloud layers and lithometers that absorb, reflect, and radiate energy. It also considers the atmospheric temperature and moisture profile, evaporational cooling, latent heat, and their effect on wind, cloud, and weather. And of course it also takes into account advection, which is the movement of moisture and temperature properties by the winds.What are the quantities that WX-SIM can forecast?
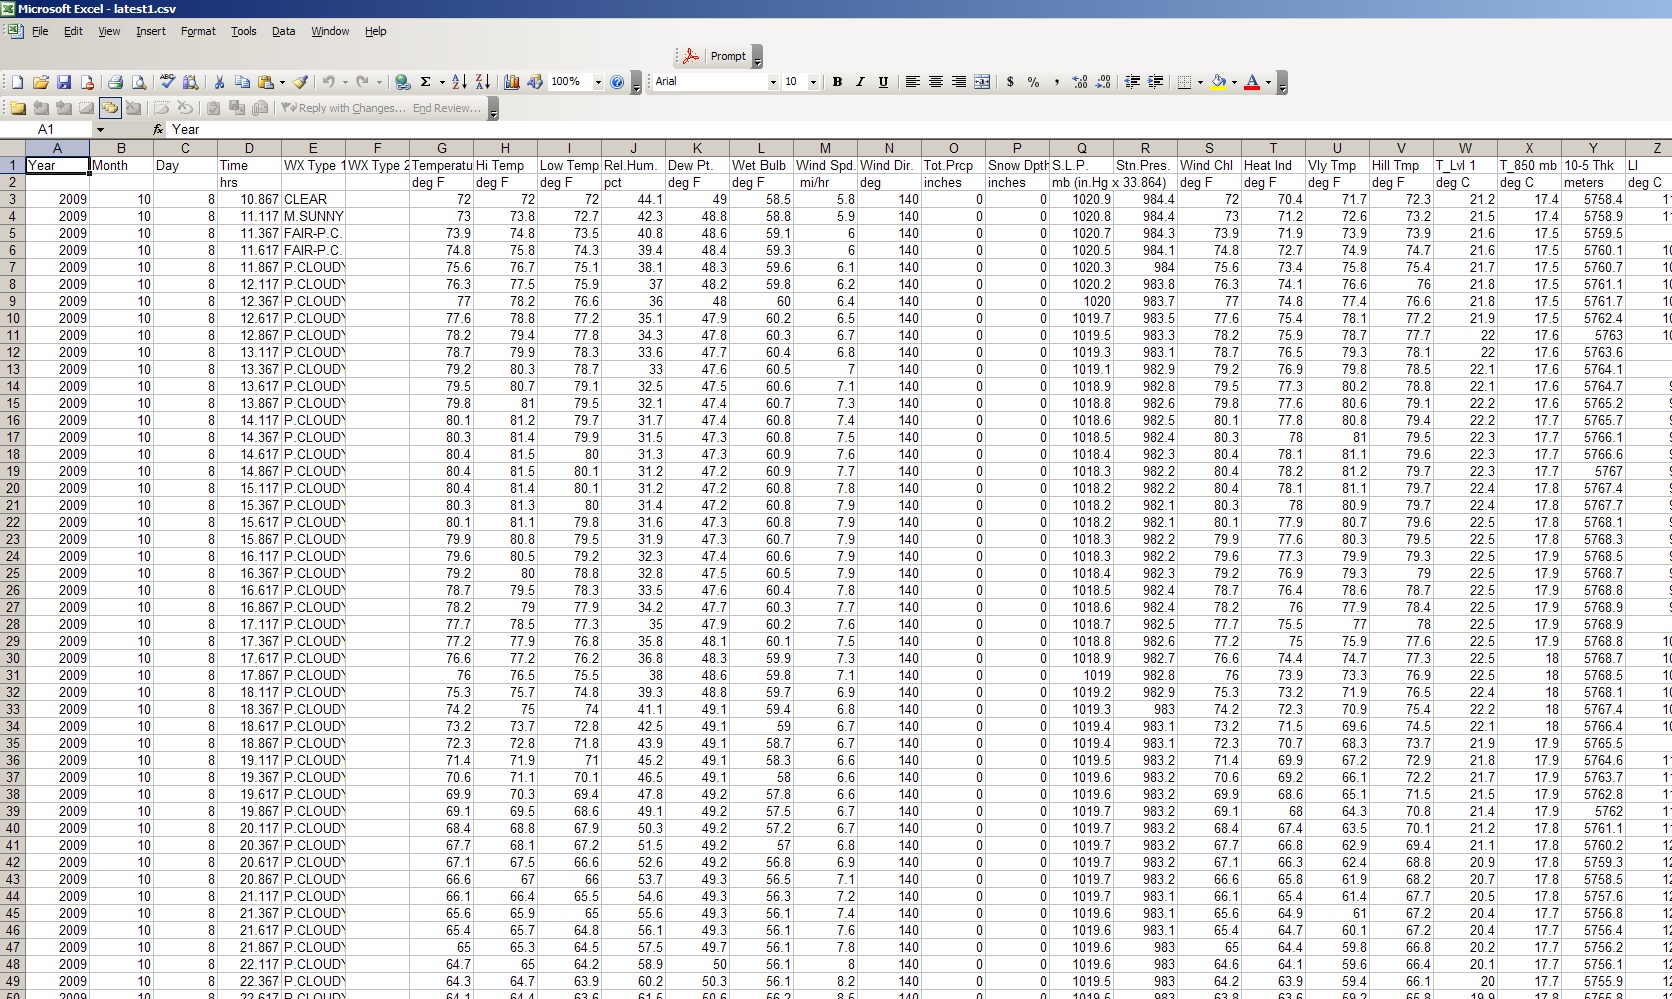
WX-SIM is capable of predicting temperature, dewpoint, wet-bulb temperature, heat index, wind chill factor, temperatures in valleys (drainage) and on hilltops (above the nocturnal inversion), sky cover, transmission of visible sunlight, solar radiation and UV index, wind direction, wind speed, precipitation total, probability of precipitation, snow depth, thickness, snow levels, upper level temperatures and dewpoint, severe weather indices, sun altitude, visibility, and more. Many of these parameters are simply not available from centralized model products found on the Internet.Can WX-SIM learn from its mistakes?
Yes, this is a capability built into the Professional version. Automatic archiving of forecasts allows for quite a collection of forecastsĀ(hundreds within a few months, for example) to be built up, and then the WRET module can be used to compare various forecast variables to actuals, and then determine bias correction data that can (optionally) be used by the program.Ā "Artificial intelligence" may not be quite the right term, but the ability to use feedback from past results is a pretty powerful feature on any forecast system.Ā In summary, specific corrections are to overall temperature, diurnal temperature range, temperature tendency towards climatology, and overall dew point.Ā It's also possible to make bias corrections to cloud cover and precipitation, based on use of these comparisons.ĀWhat is the difference between the Standard and Professional version?
The Standard version is suitable for most users and includes the vast majority of the features described above. Tom Ehrensperger states that most users should be fine with the Standard Version unless they are interested in monitoring model biases or using the more advanced, experimental parameters offered by WX-SIM. A complete list of differences follow:| Standard Version | Professional Version | |
|---|---|---|
| Customization | Tom Ehrensperger accomplishes a standard configuration of variables for your site. | Tom Ehrensperger completes a very detailed configuration of variables for your site. |
| Model Bias adjustment | Not available. | Included. |
| Data Entry Form | Auto stratus, auto cumulus, auto haze, urban heat island adjustment, cull/append, and test for midpoints are not available. | All items are available. |
| Upper Air Form | Only "1-click" adjustment can be used to reconcile the sounding data with model data. | All items are available. |
| Advection Form | "Two Upwind Sites", "Direct Click", "Use Previous", and "change wind direction" slider are not available. | All items are available. |
| Interrupt Planner | Clearing, saving, recall, 850 mb RH, and "reduce superadiabatic" options are not available. | All items are available. |