Weather plotting charts
Listed here are a number of key diagrams, plotting charts, and other graphics scanned by Weather Graphics and provided as a courtesy for forecasters. The PDF link provides the diagram in a letter-sized document. To print to 11x17" or other sizes, use the Page Handling options in Adobe Reader. Nearly all of these graphics are the work of the federal government and no copyright is claimed. We will likely add additional charts from our collection in the near future.Thermodynamic Diagrams |
|
|---|---|
|
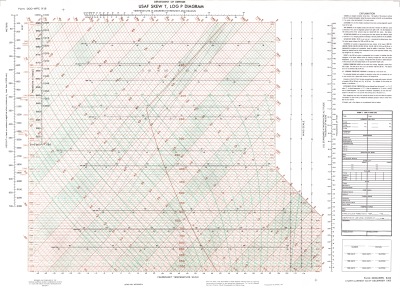
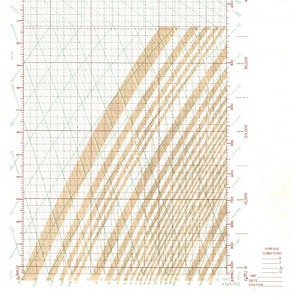
Skew-T log P diagram, basic. This is the primary, essential Skew-T diagram. SOURCE: U.S. Air Force DOD WPC 9-16 (1987). JPG: wpc-916.jpg PDF: wpc-916.pdf |

|
Skew-T log P diagram, Compact SOURCE: U.S. Air Force DOD WPC 9-16-1 (1978). JPG: wpc9161.jpg PDF: wpc9161.pdf |
|
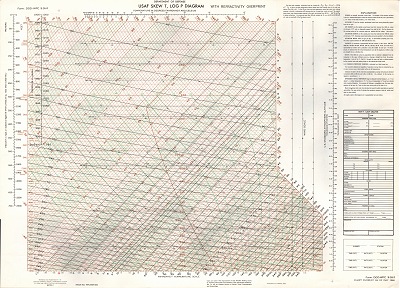
Skew-T log P diagram, with refractivity overprint SOURCE: U.S. Air Force DOD WPC 9-16-2 (1968). JPG: wpc9162.jpg PDF: wpc9162.pdf |
|
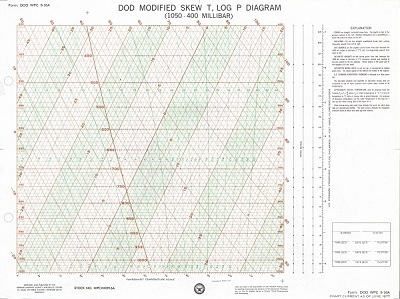
Skew-T log P diagram, 1000-400 mb (low level). This is a chart that is useful for working with inversions and performing accurate analysis of LCLs and parcels. SOURCE: U.S. Air Force DOD WPC 9-16A (1977). JPG: wpc916a.jpg PDF: wpc916a.pdf |
|
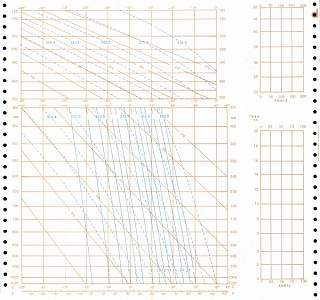
Skew-T log P diagram, formfeed version. This was presumably used for dot-matrix or teleprinter output from centers or from local software. SOURCE: Unknown; probably U.S. Weather Bureau late 1960s. JPG: skew_formfeed.jpg PDF: skew_formfeed.pdf |
|
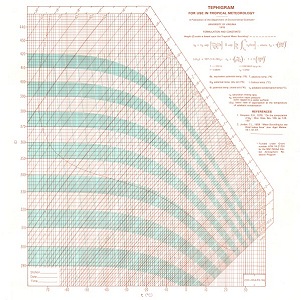
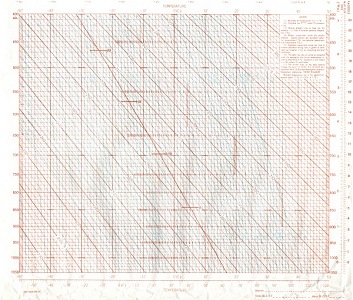
Tephigram. This is one of the other significant types of thermodynamic diagrams. SOURCE: University of Virginia & NSF Grant ATM 74-21701 (1978). JPG: tephigram_trop.jpg PDF: tephigram_trop.pdf |
|
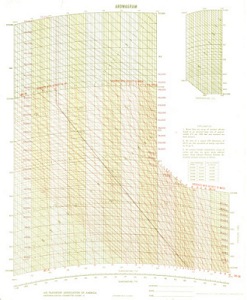
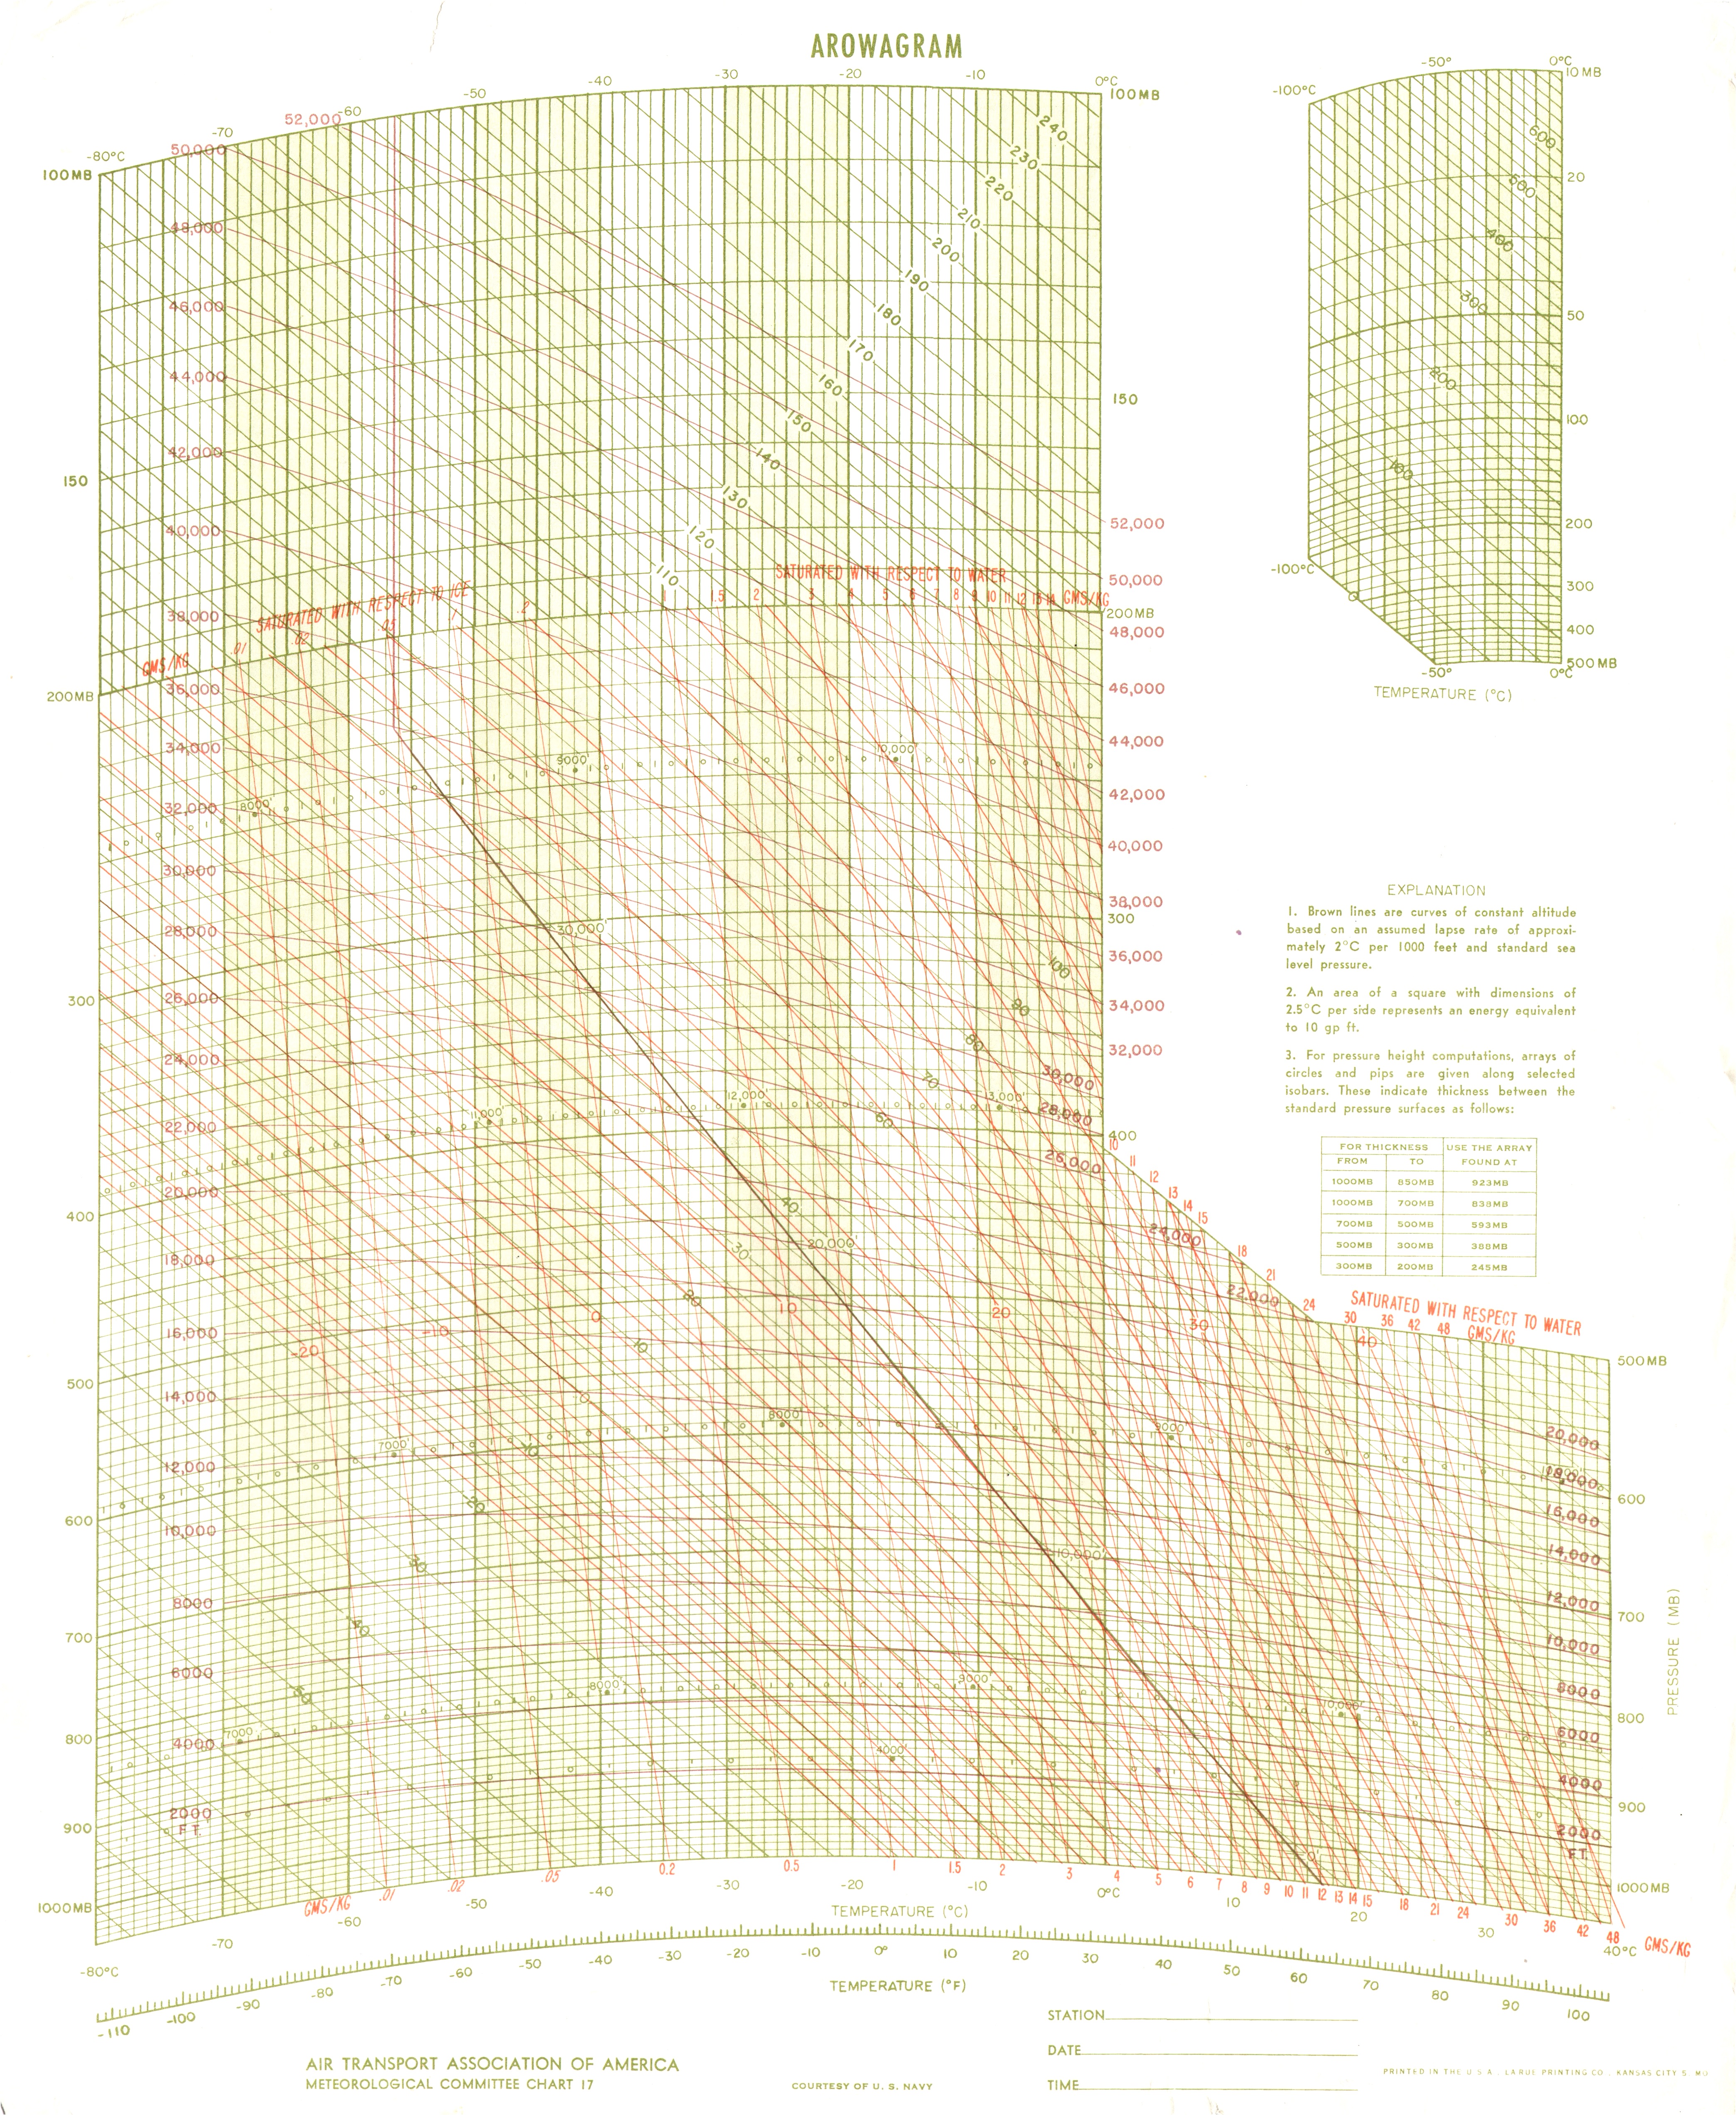
Arowagram. This type of thermodynamic diagram was preferred by the U.S. Navy in the 1950s and was useful for calculating refraction. SOURCE: ATA Chart 17, reproduction of U.S. Navy diagram OPNAV FORM 3140-3 (aprx. 1950). JPG: arowagram.jpg PDF: arowagram.pdf |
|
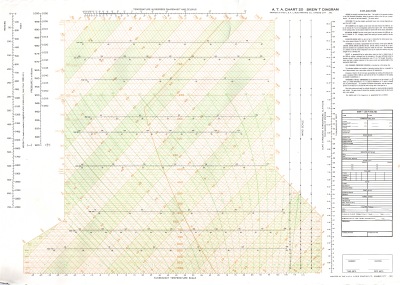
Skew-T log P diagram. This is essentially an ATA reproduction of WPC 9-16. SOURCE: ATA Chart 20 (aprx. 1950). JPG: ata20.jpg PDF: ata20.pdf |
|
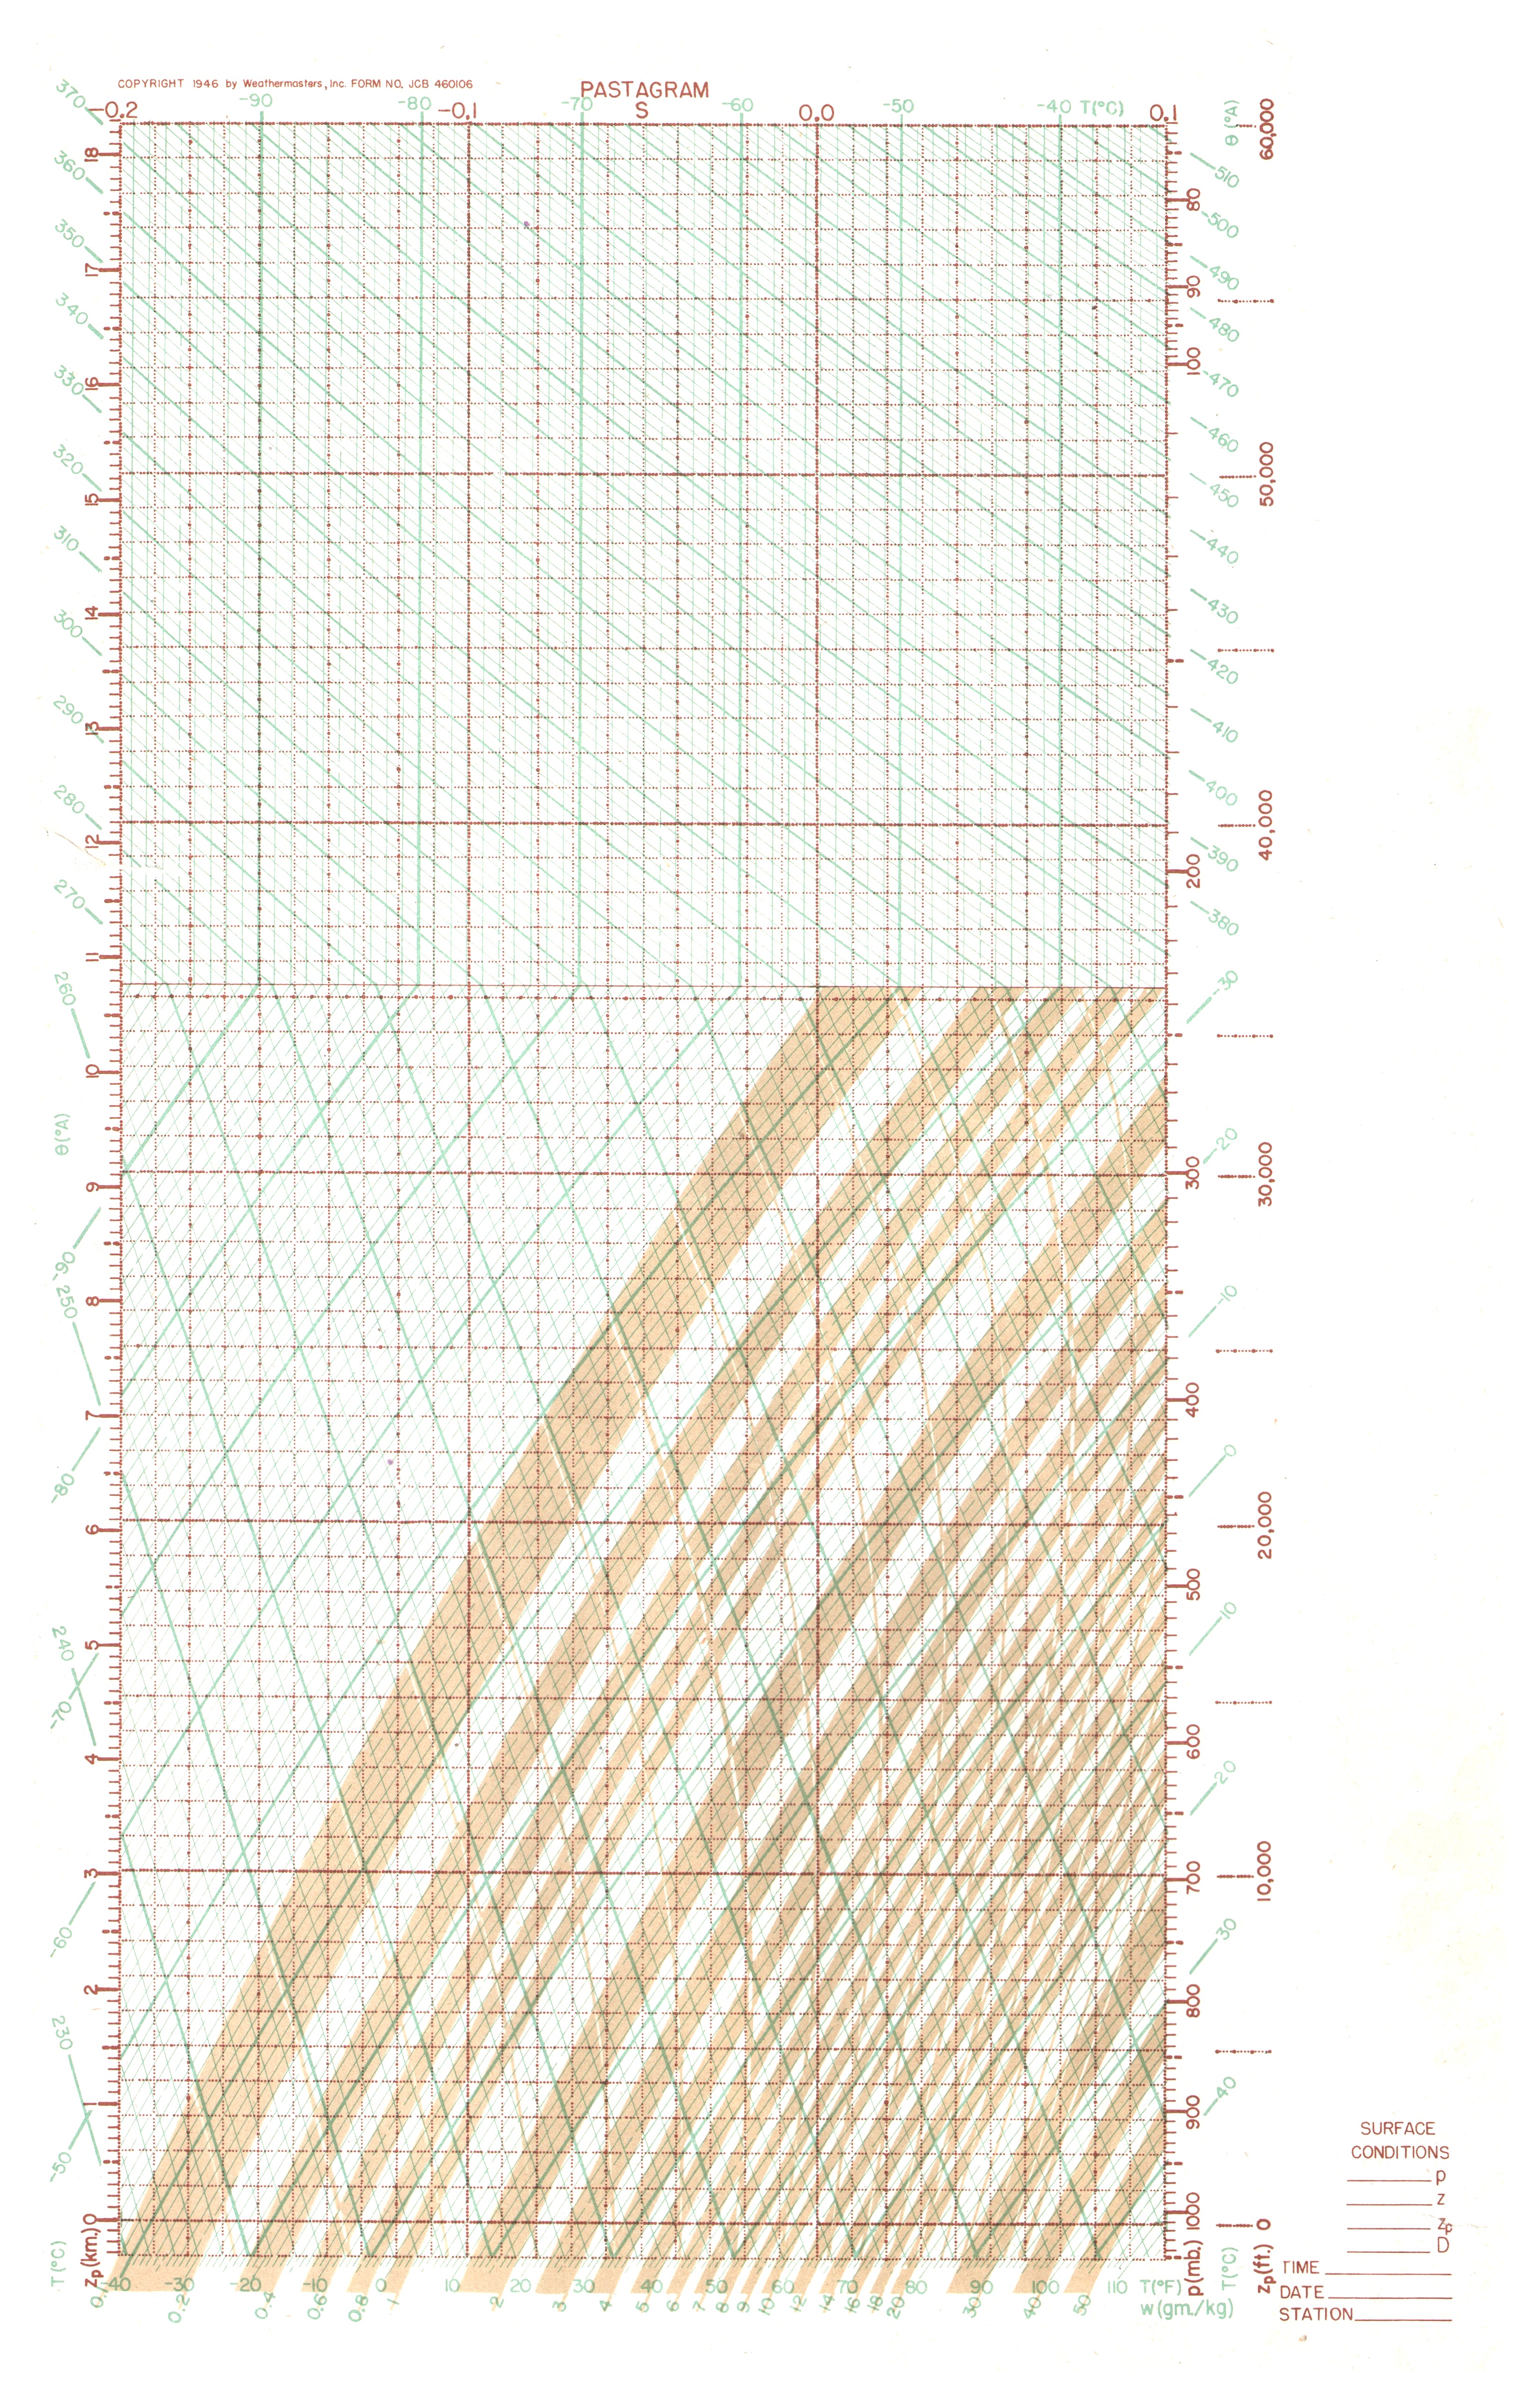
Pastagram. The pastagram was introduced by John C. Bellamy in 1945. It is essentially a skew-T diagram but the upper part is an emagram. SOURCE: Weathermasters Form JCB 460106 (1946), presumably for university or U.S. Weather Bureau use. SOURCE (Literature): Bellamy, John C., 1945: The use of pressure altitude and altimeter corrections in meteorology. J. Meteor., 2, 1-79. JPG: pastagram.jpg PDF: pastagram.pdf |
|
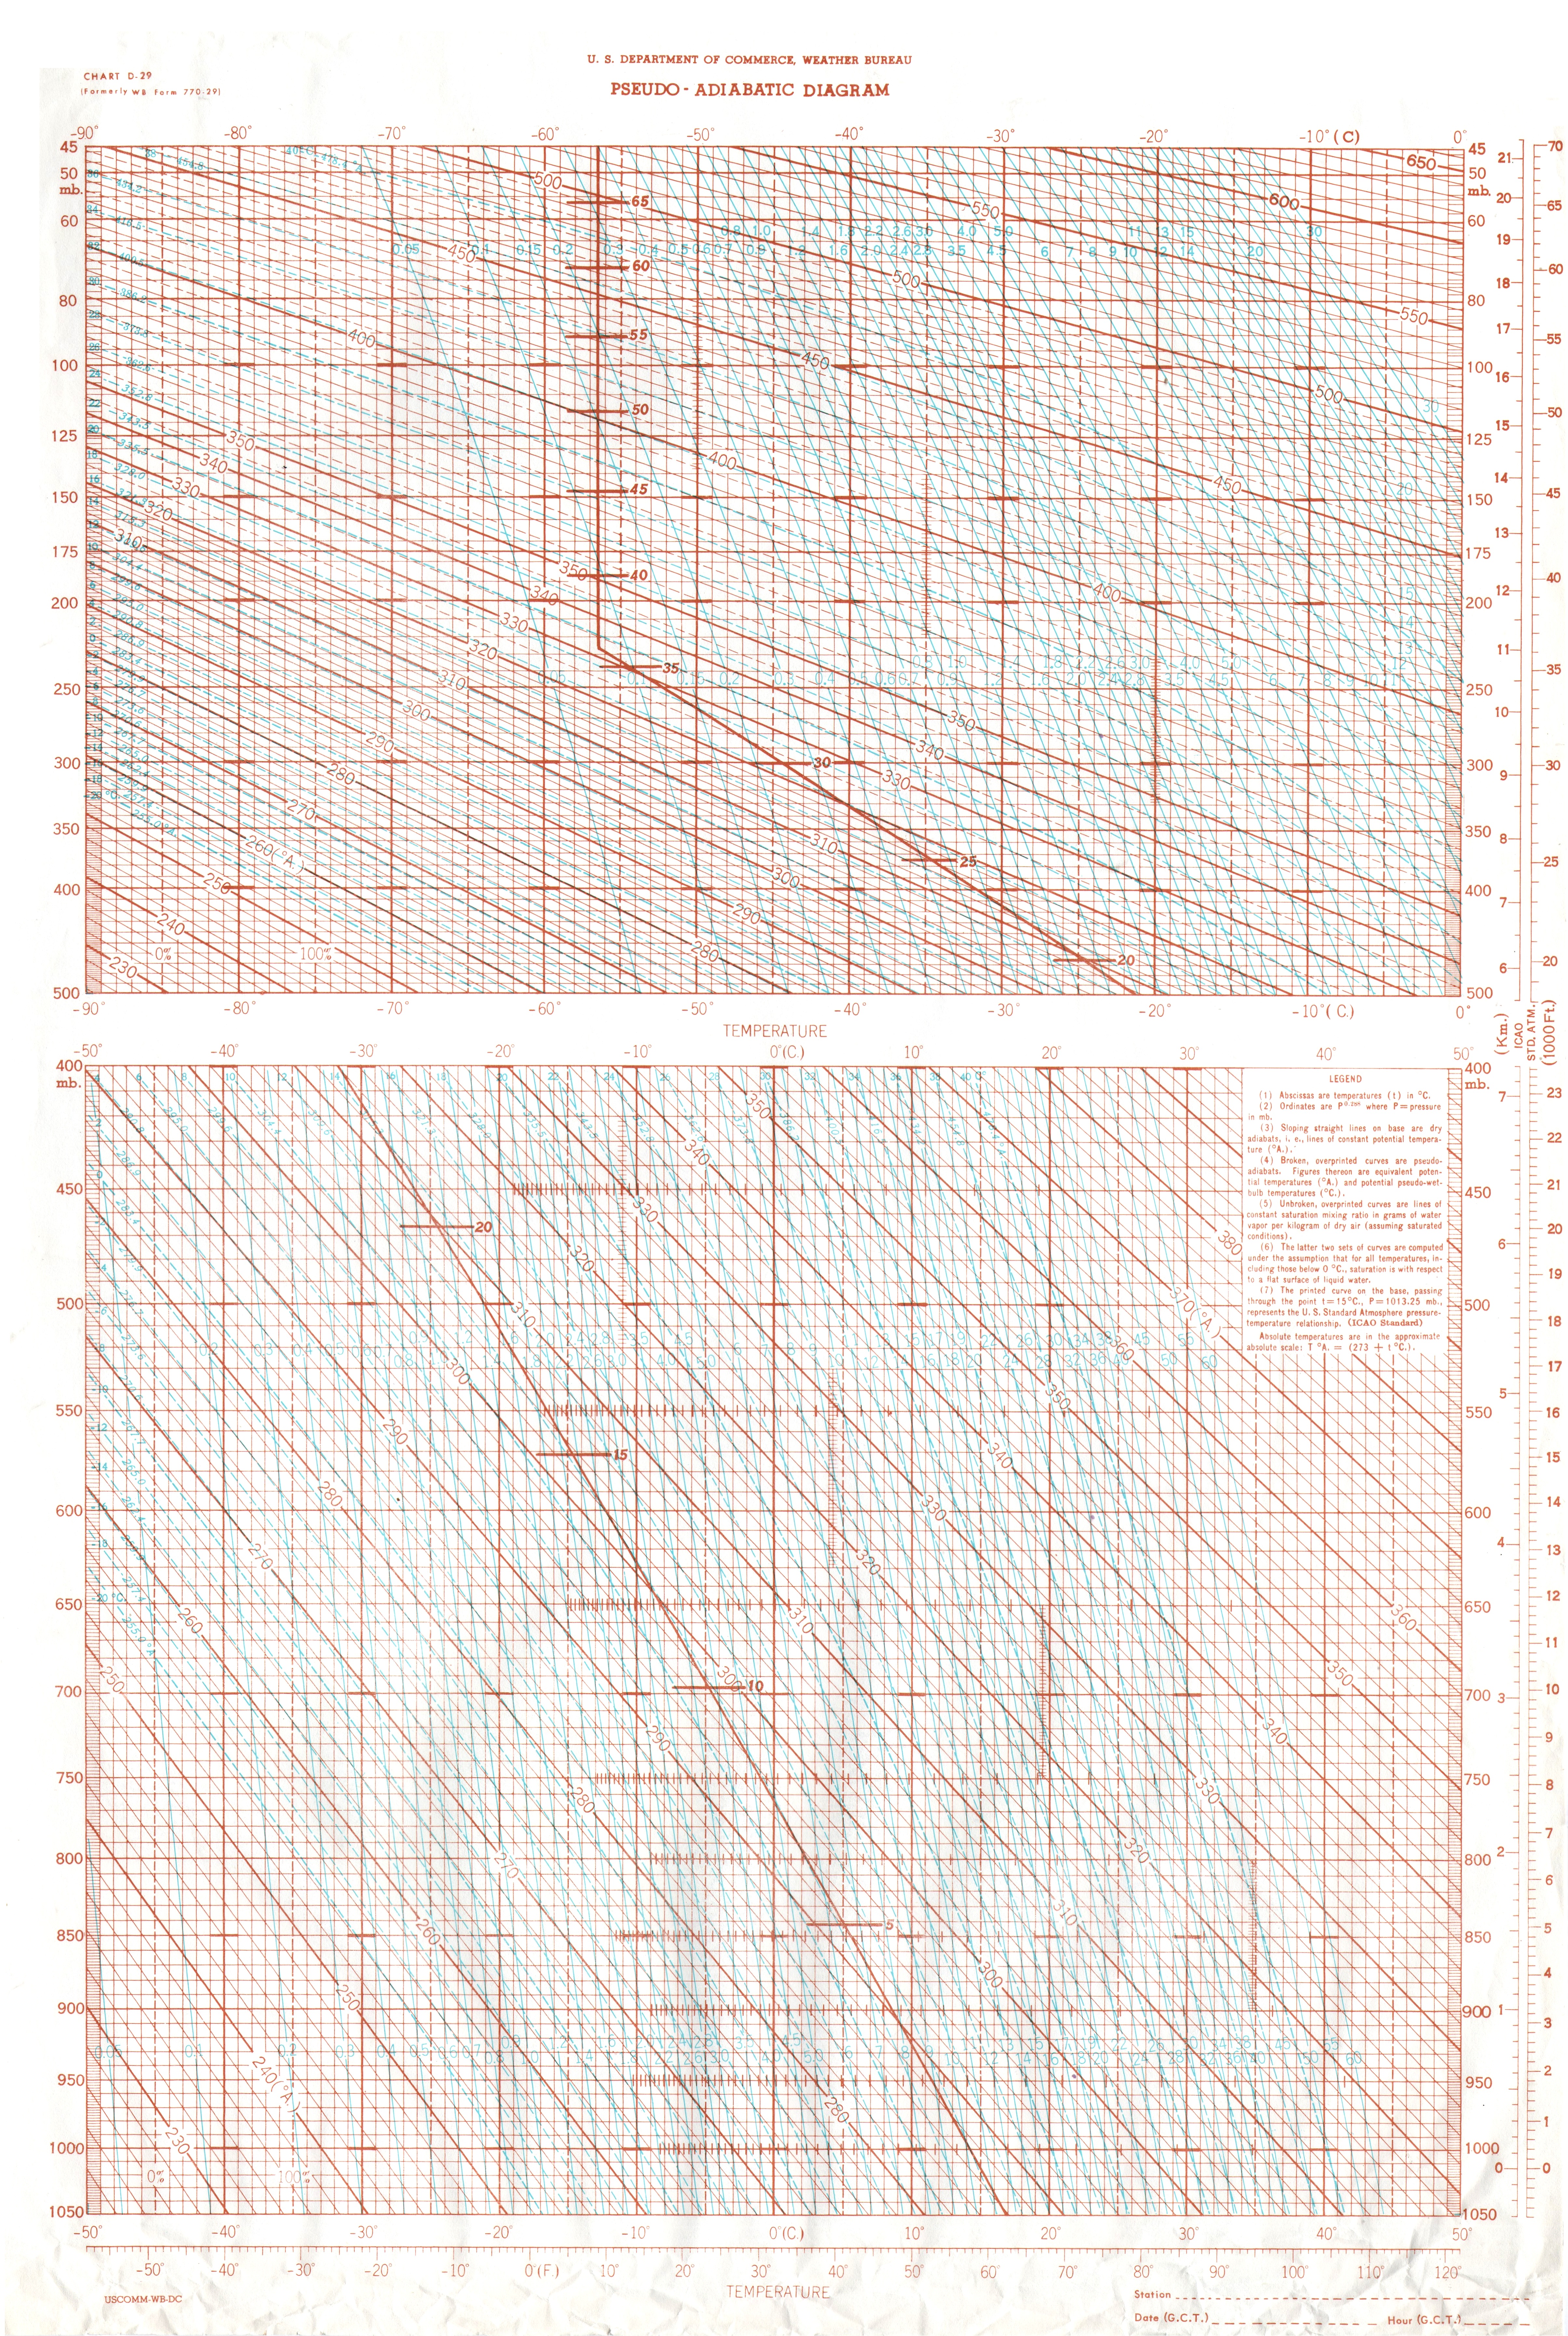
Pseudoadiabatic diagram. Basically an emagram. SOURCE: USWB Chart D-29 (aprx 1958-1960). JPG: pseudoadiabatic.jpg PDF: pseudoadiabatic.pdf |
Vector Diagrams |
|
|
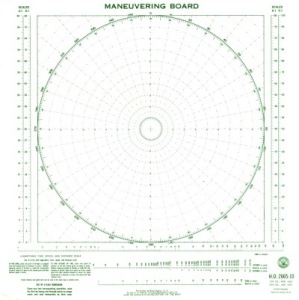
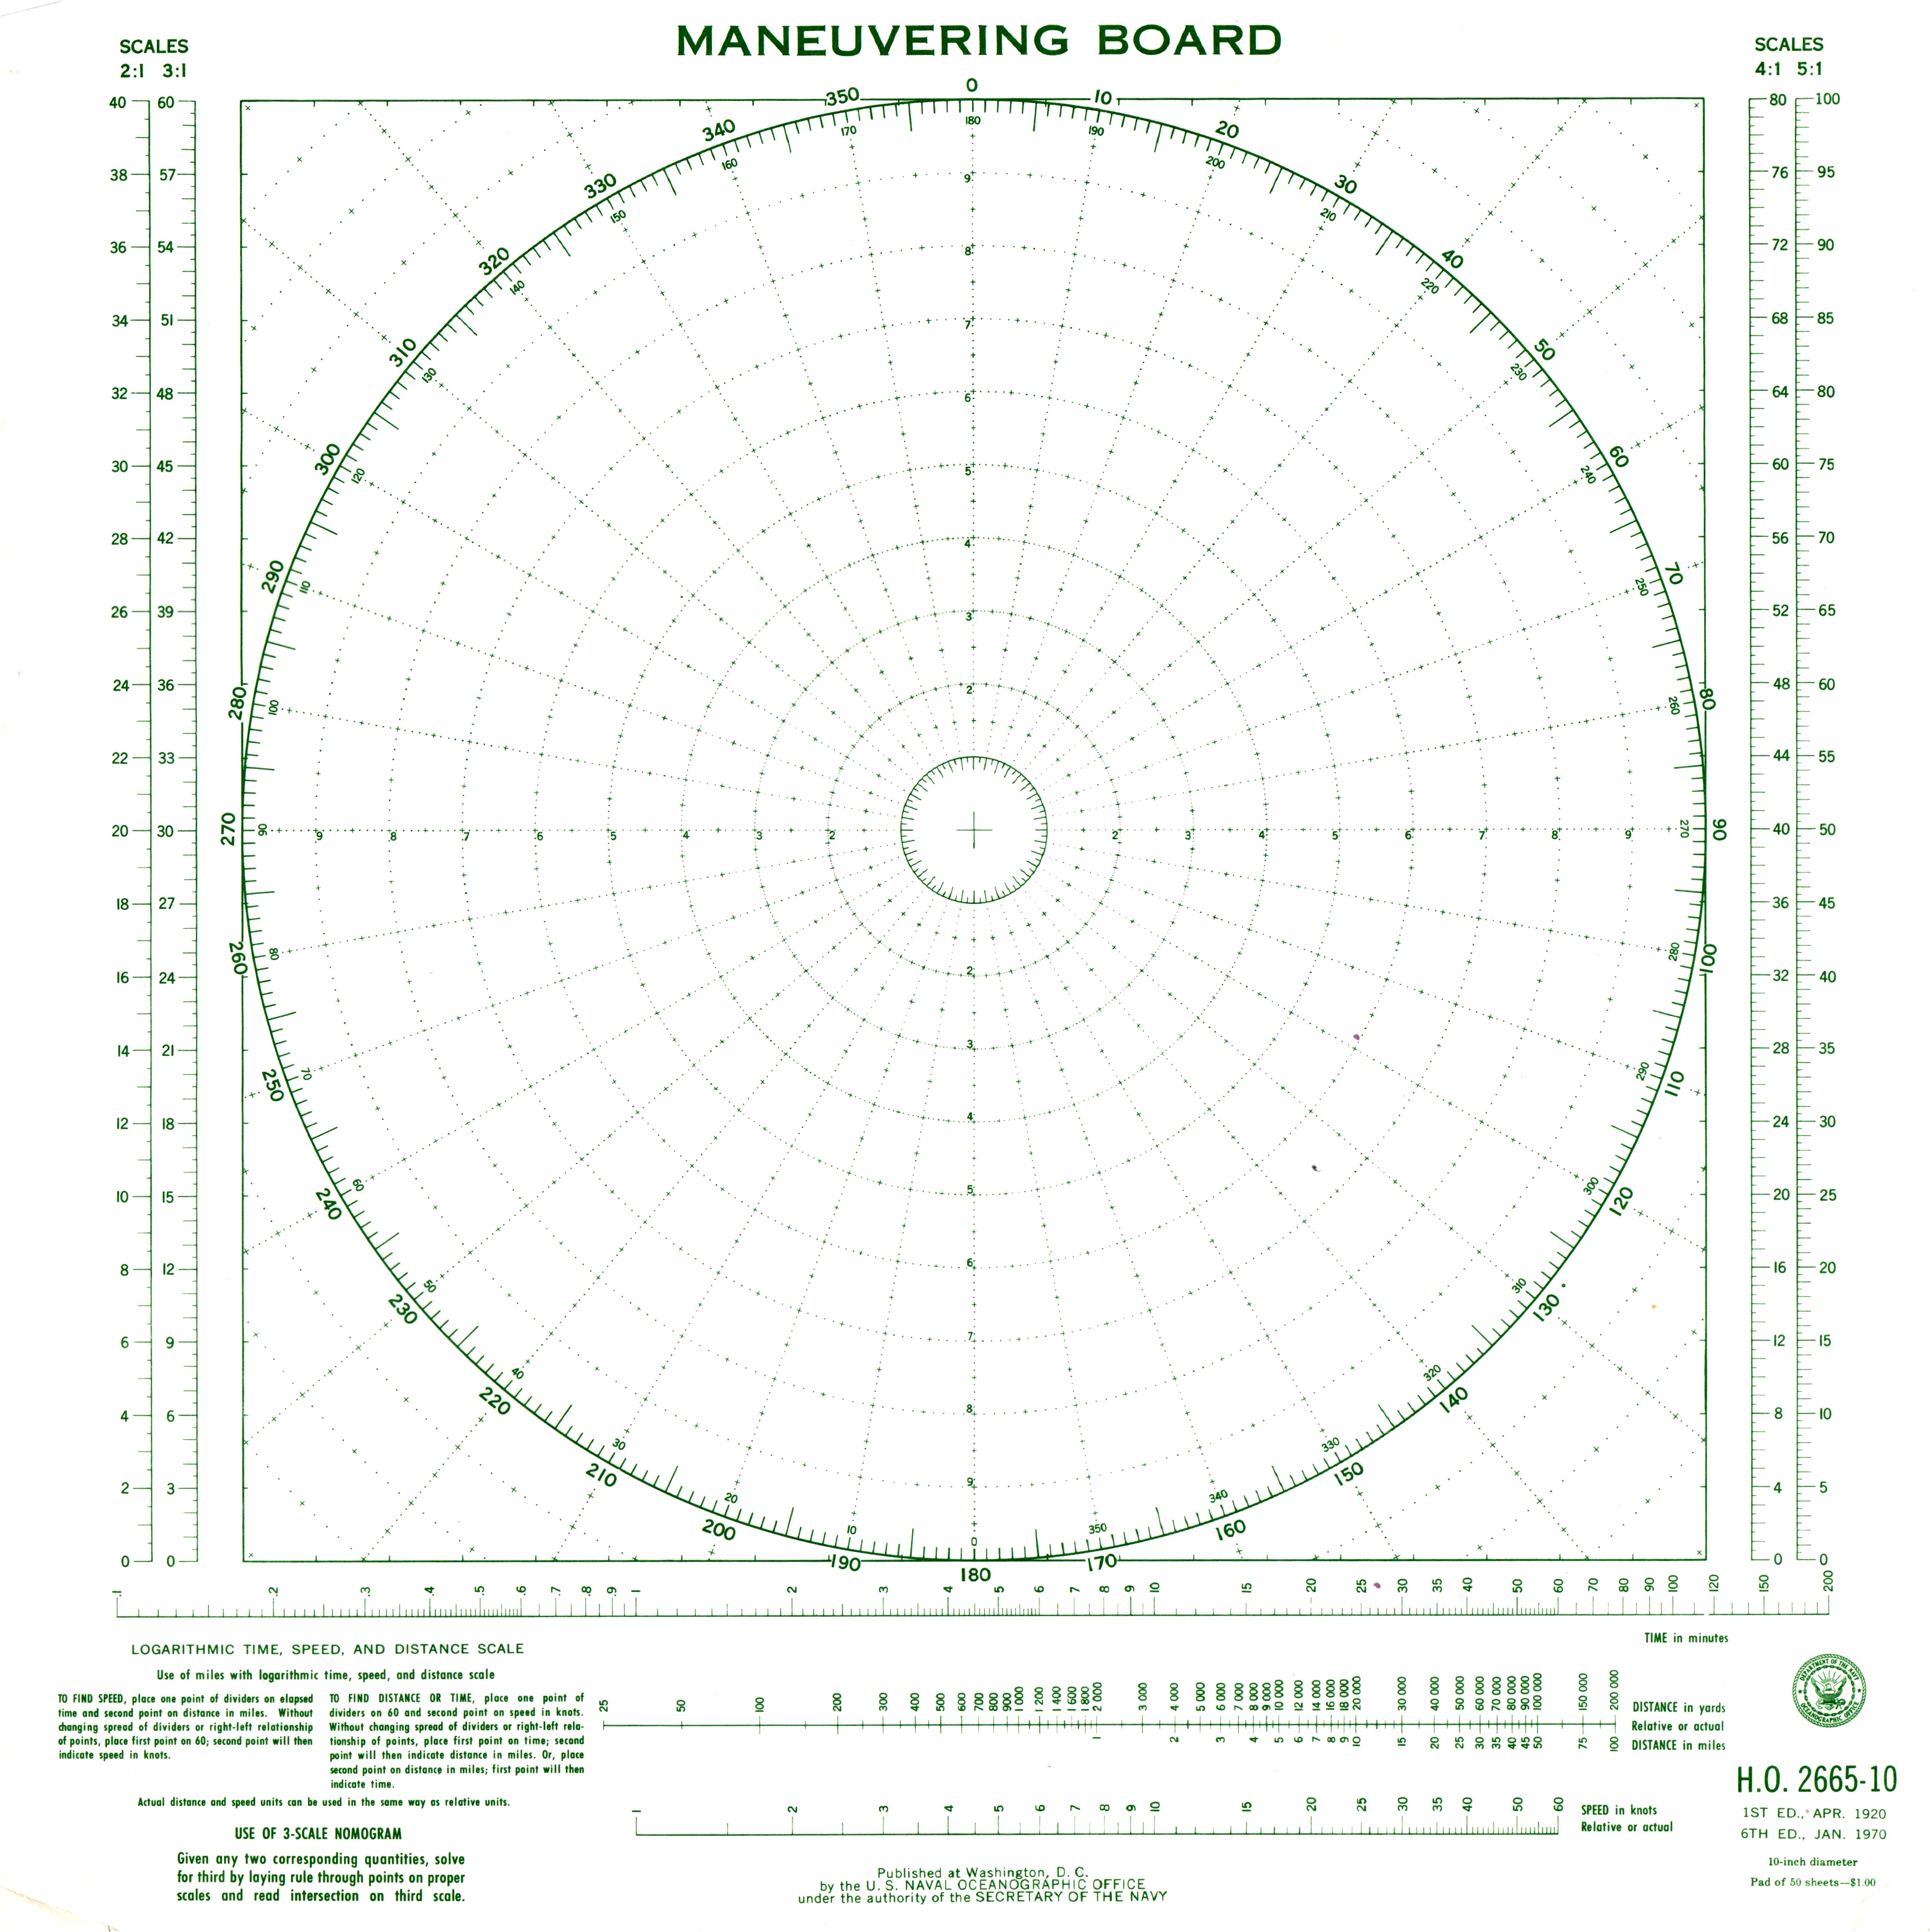
Maneuvering board. Can also be used as a hodograph. SOURCE: U.S. Navy H.O. 2665-10 (1970). JPG: usn_ho-2665-10_1970.jpg PDF: usn_ho-2665-10_1970.pdf |
Weather Plotting Charts |
|

|
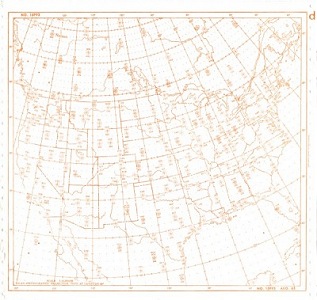
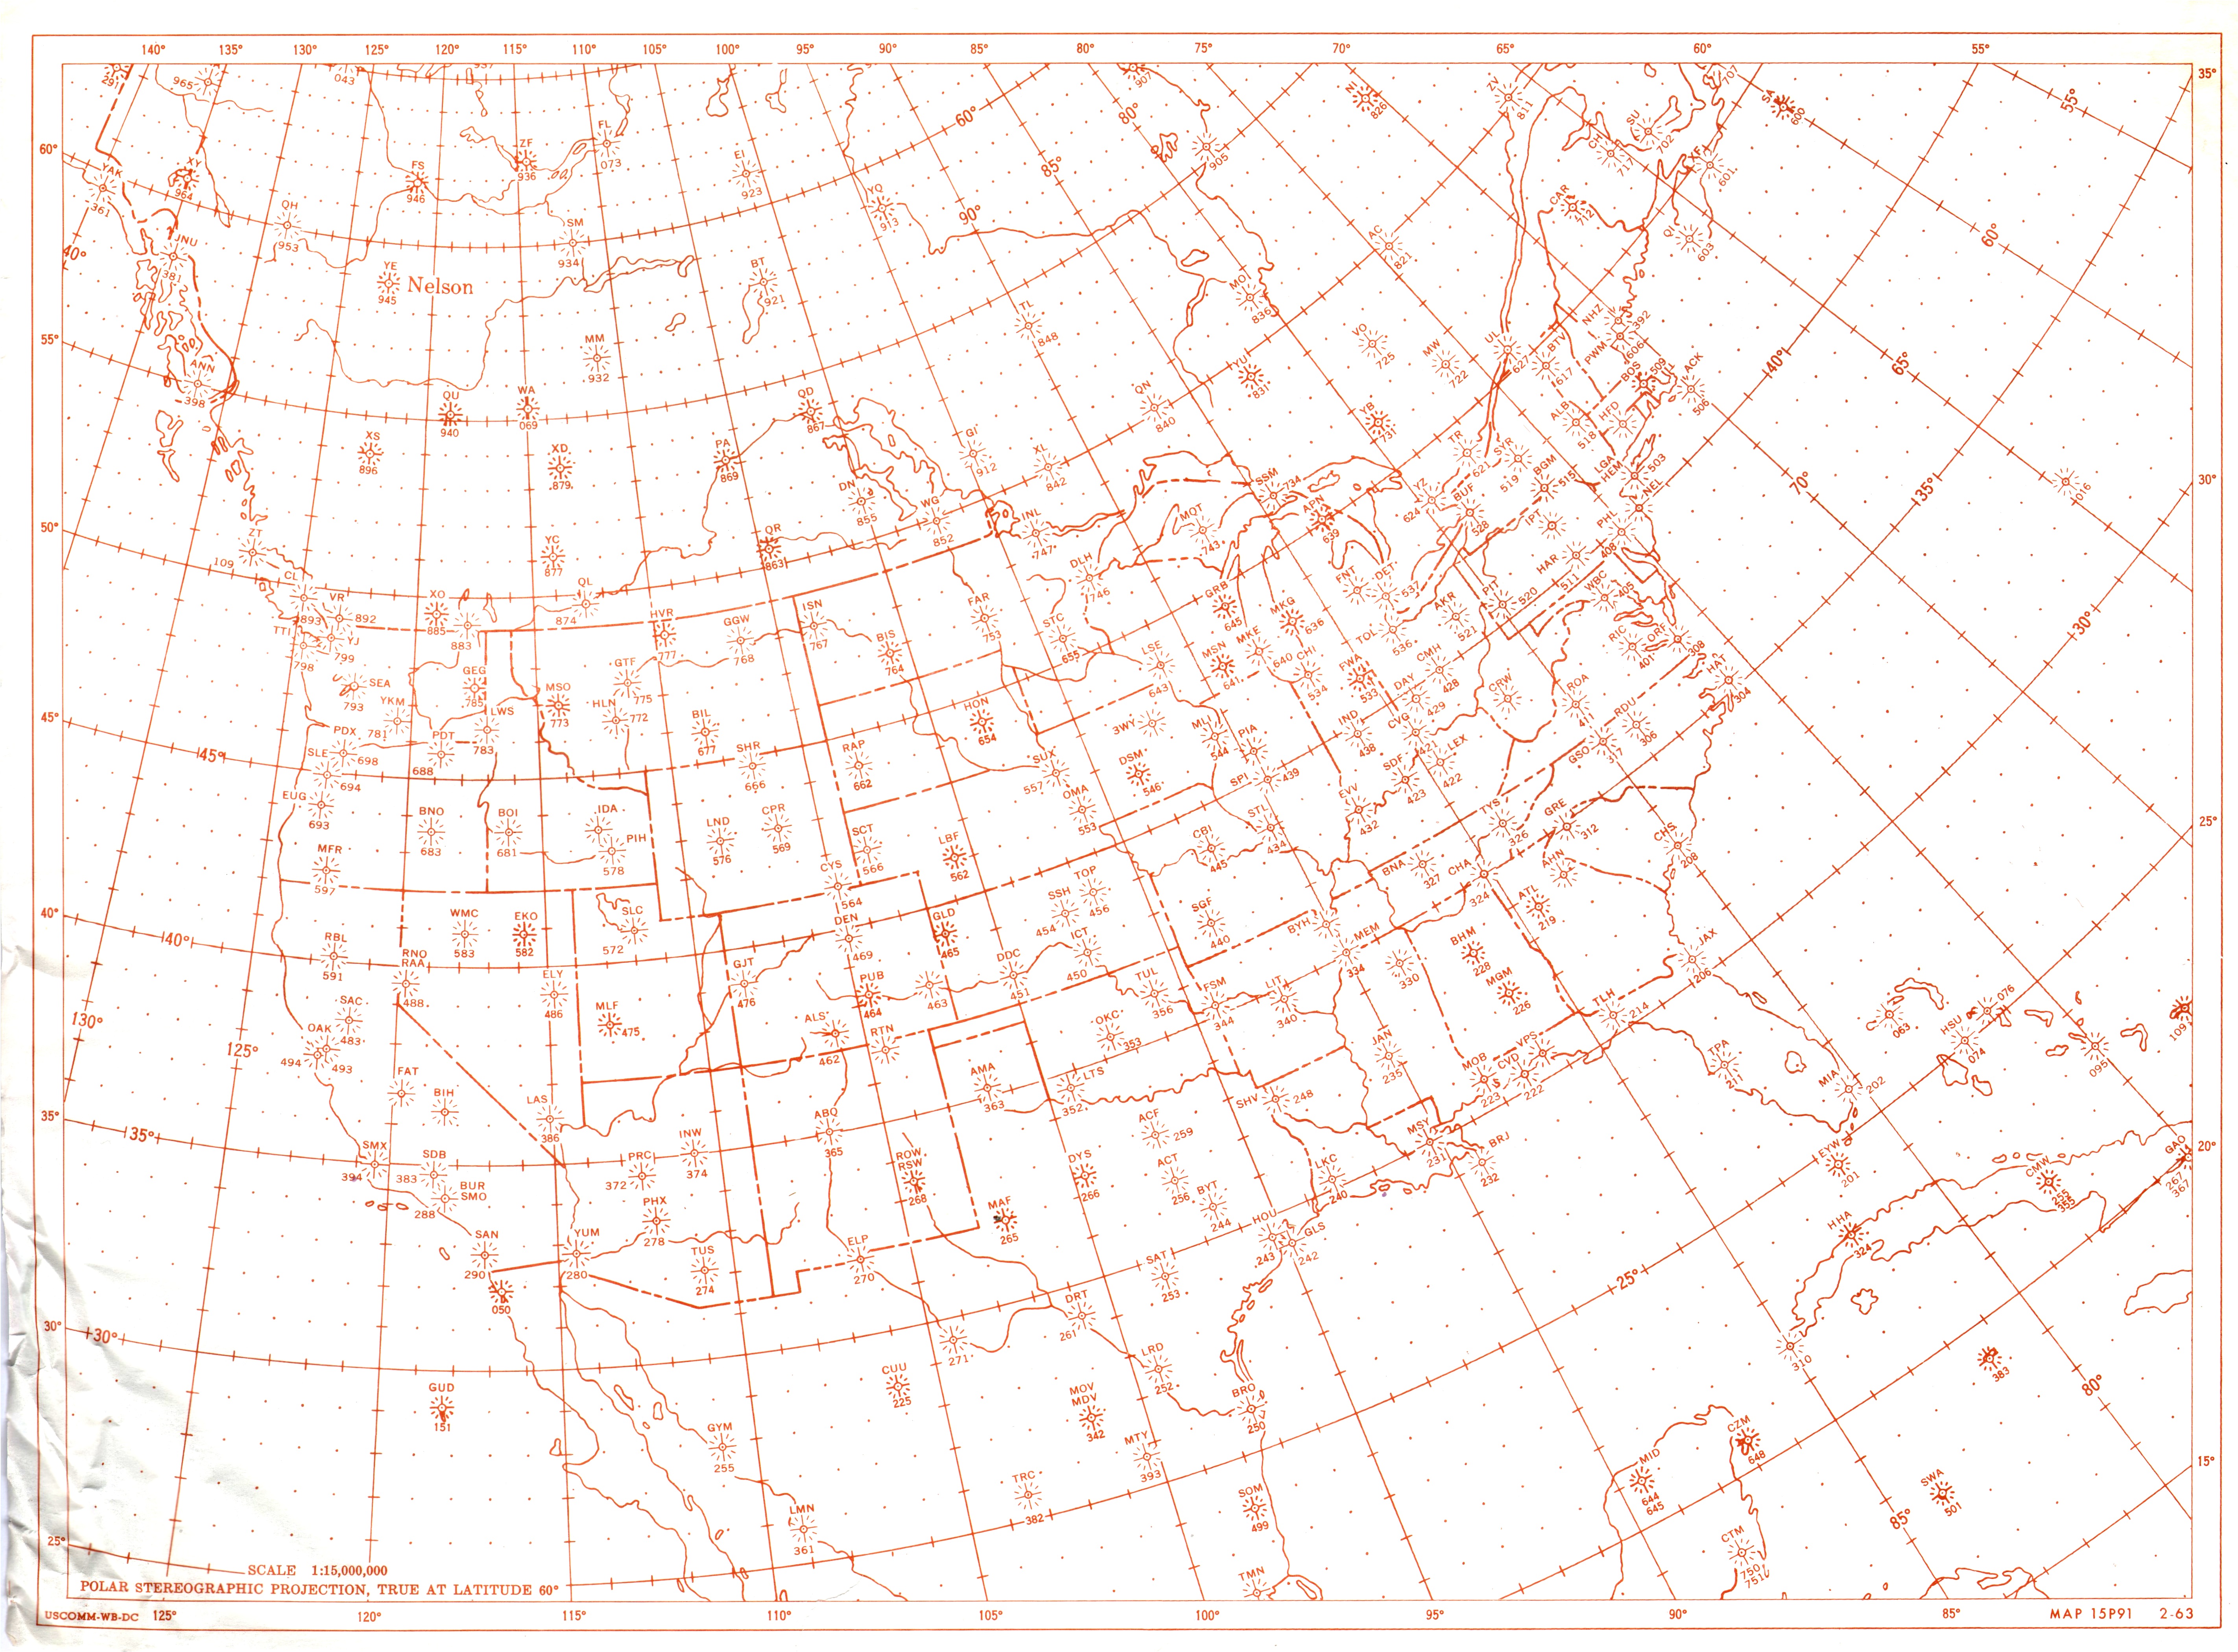
United States JPG: uswb_15p91_1963.jpg PDF: uswb_15p91_1963.pdf |
|
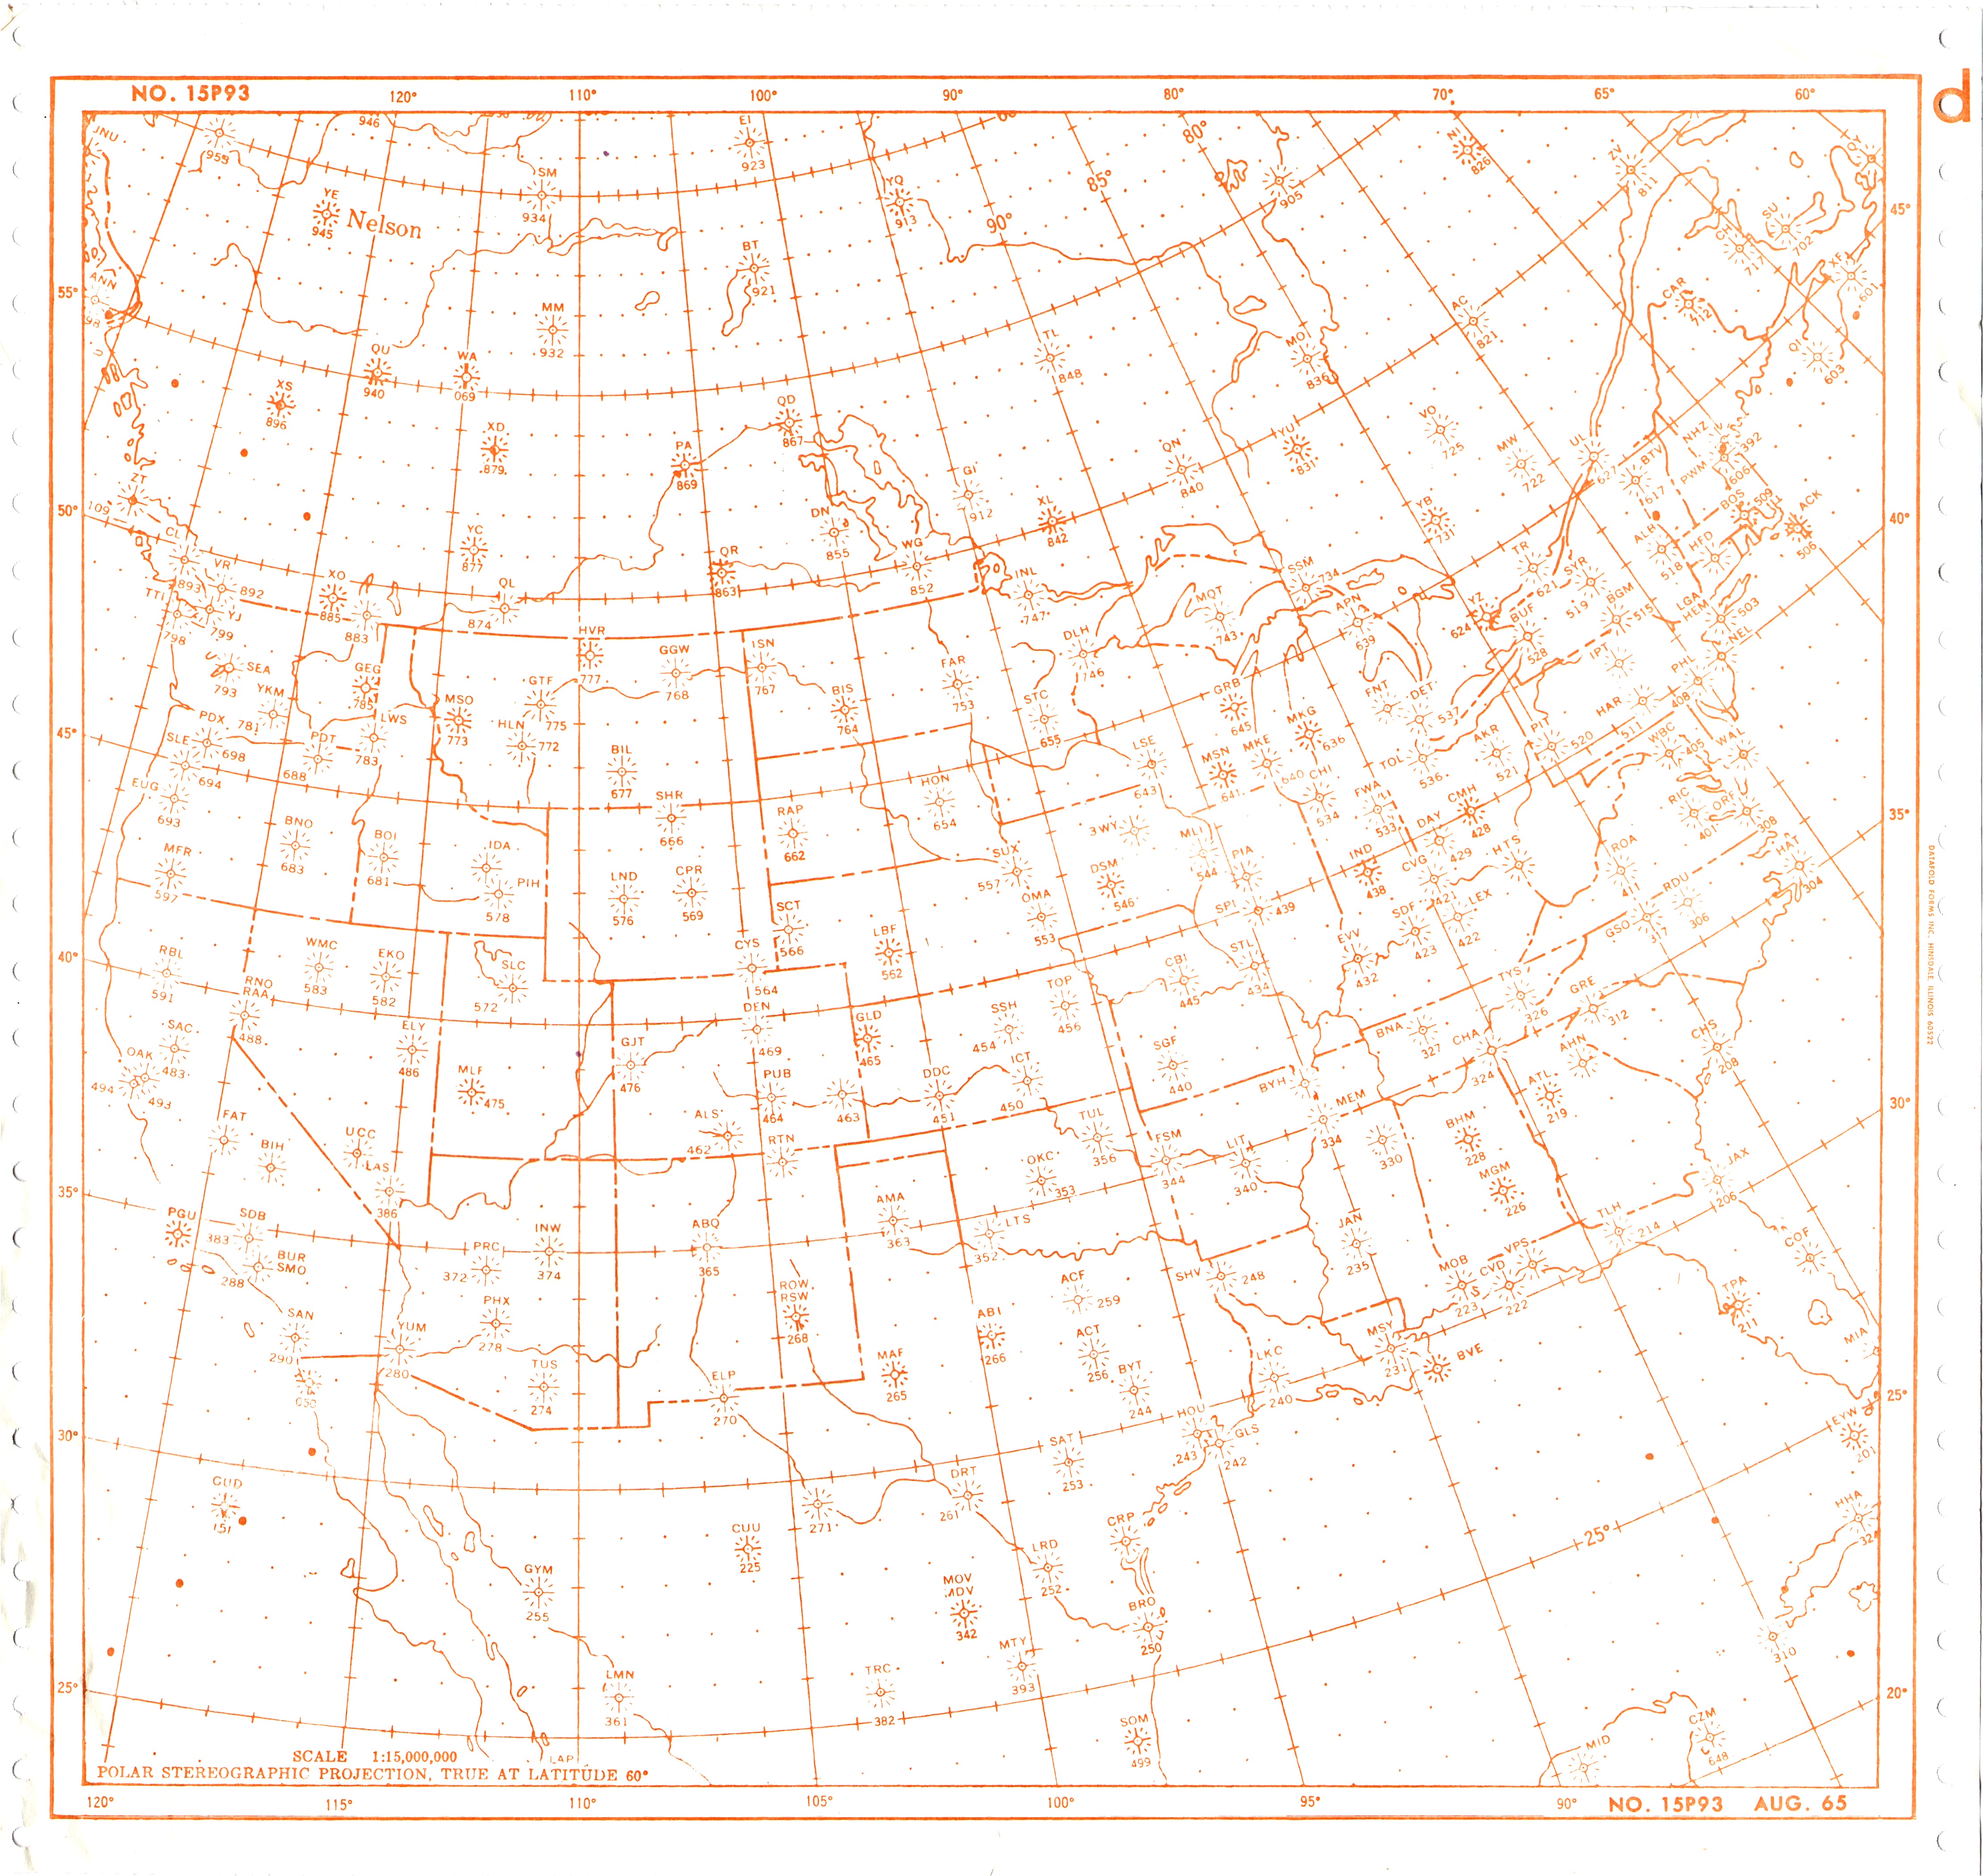
United States (compact) JPG: uswb_15p93_1965.jpg PDF: uswb_15p93_1965.pdf |

|
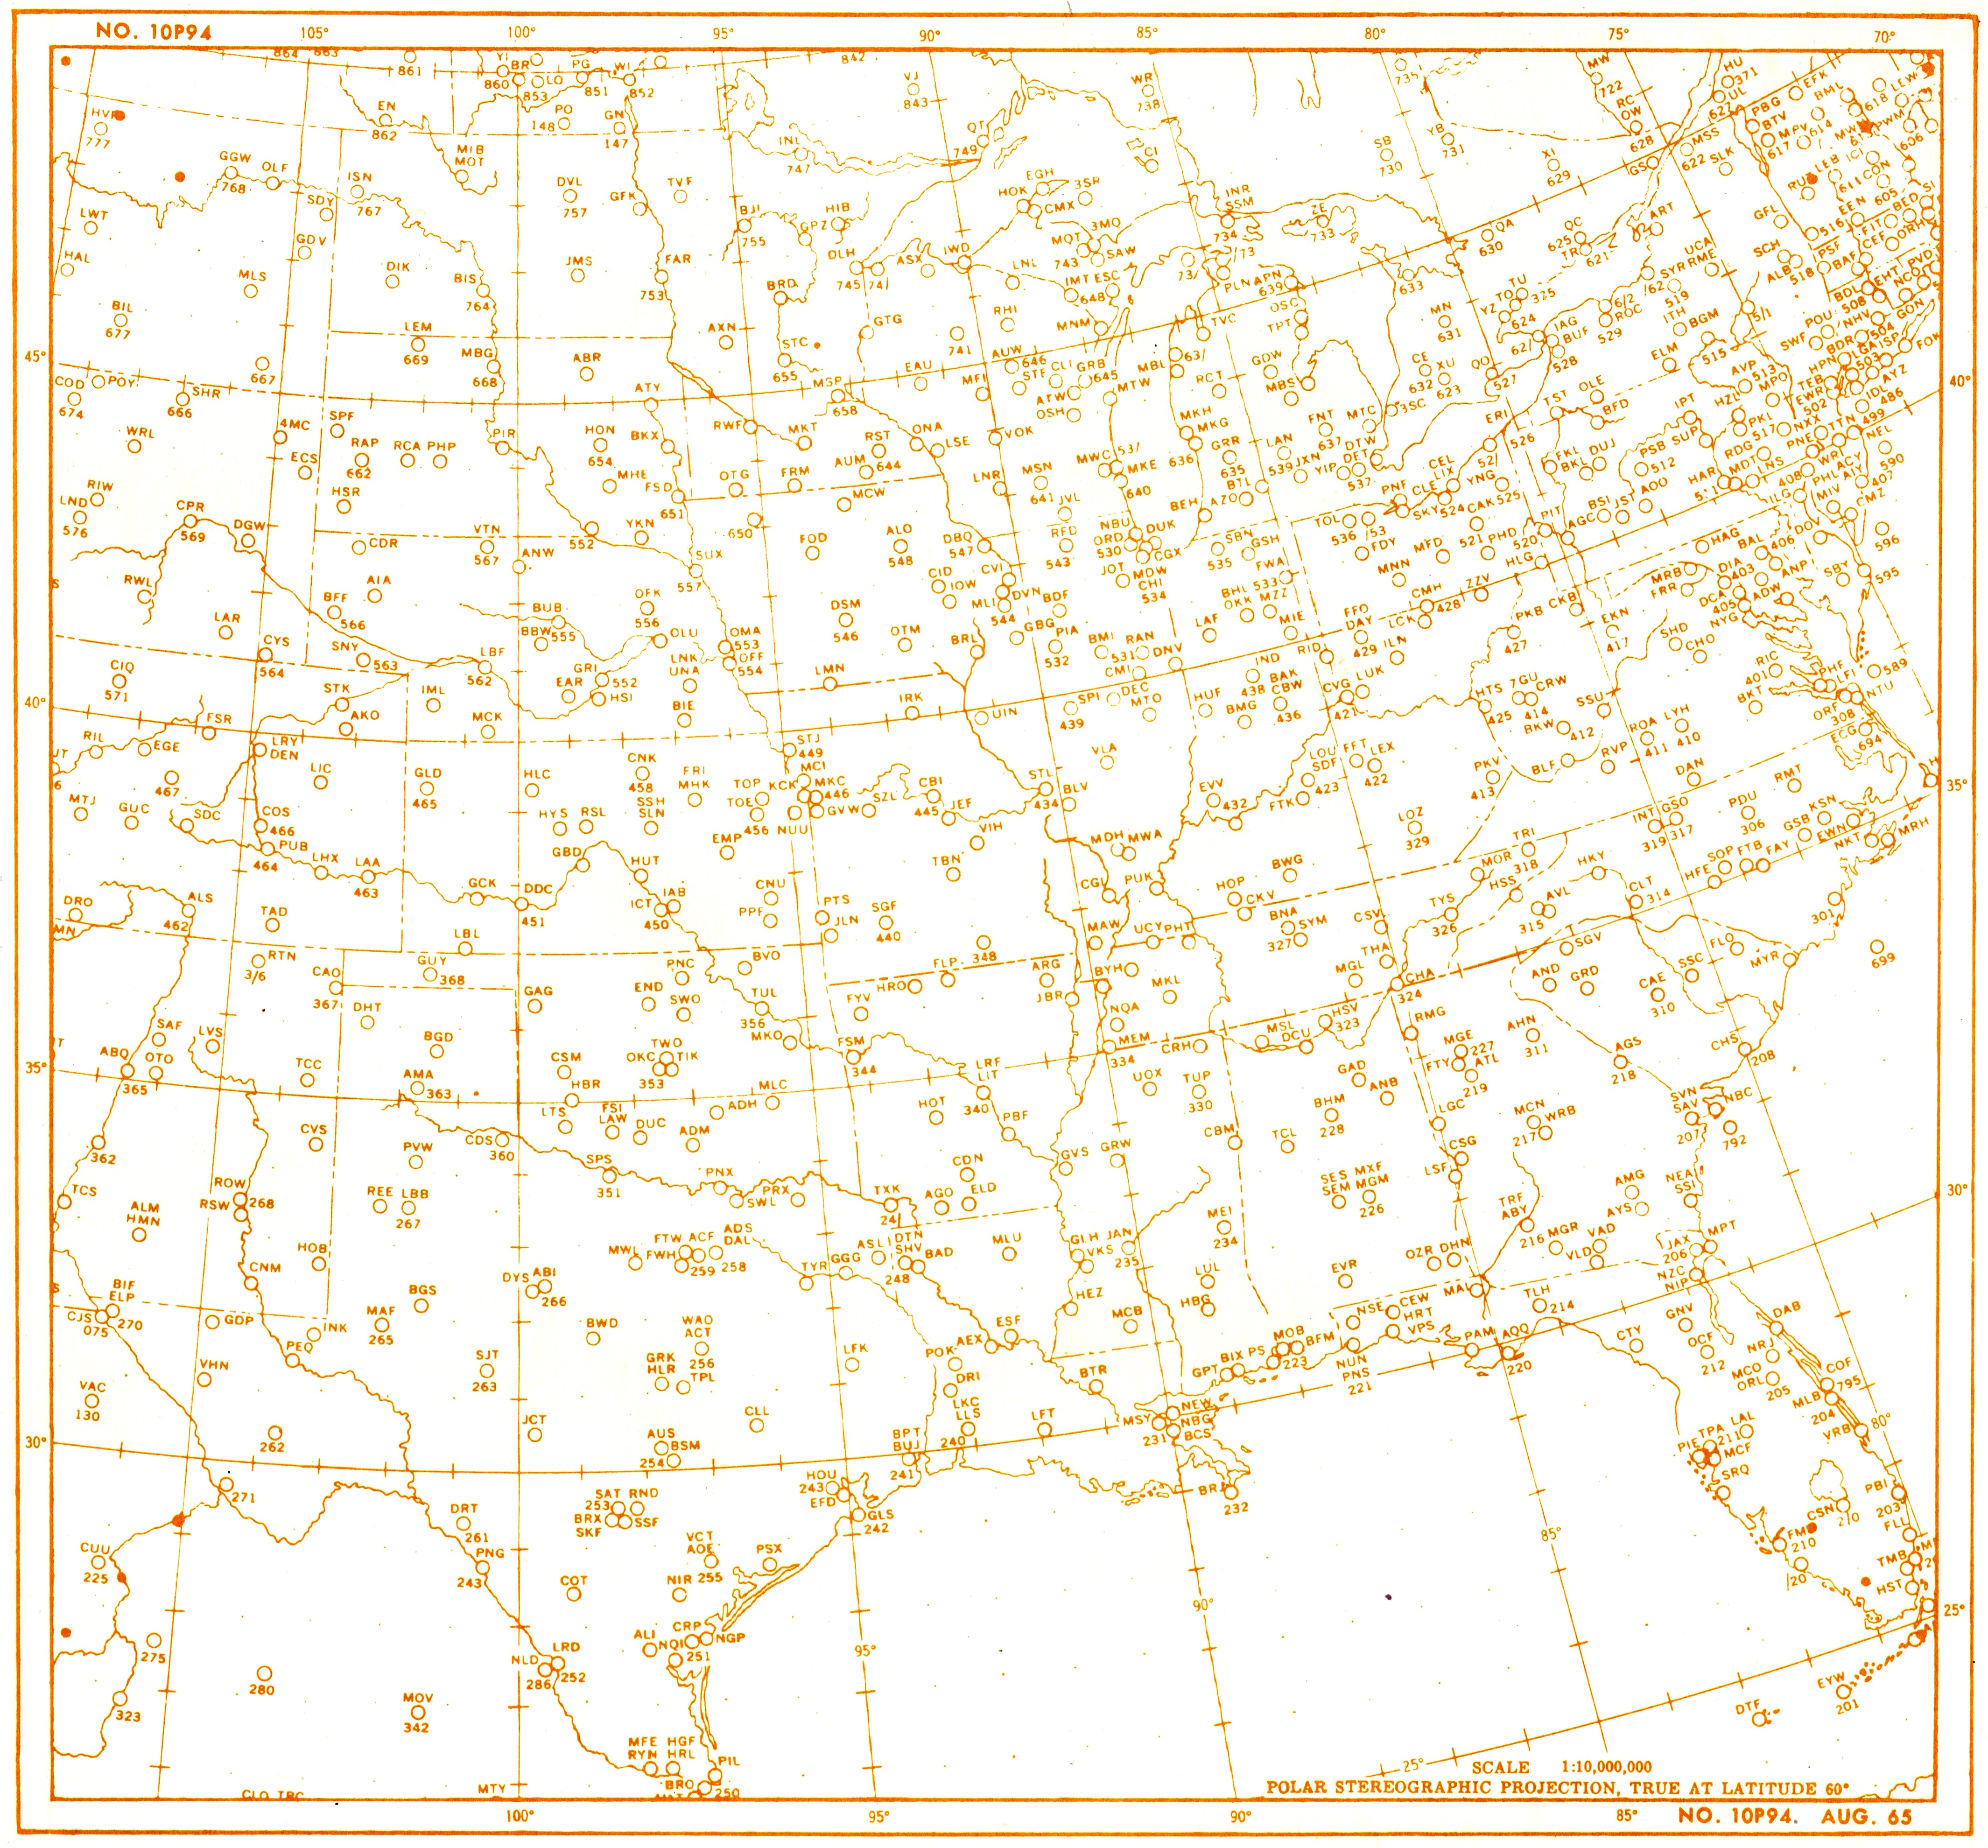
Southeast United States JPG: uswb_10p94_1965.jpg PDF: uswb_10p94_1965.pdf |
|
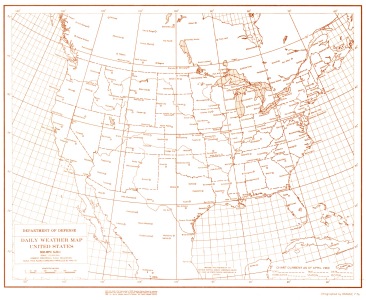
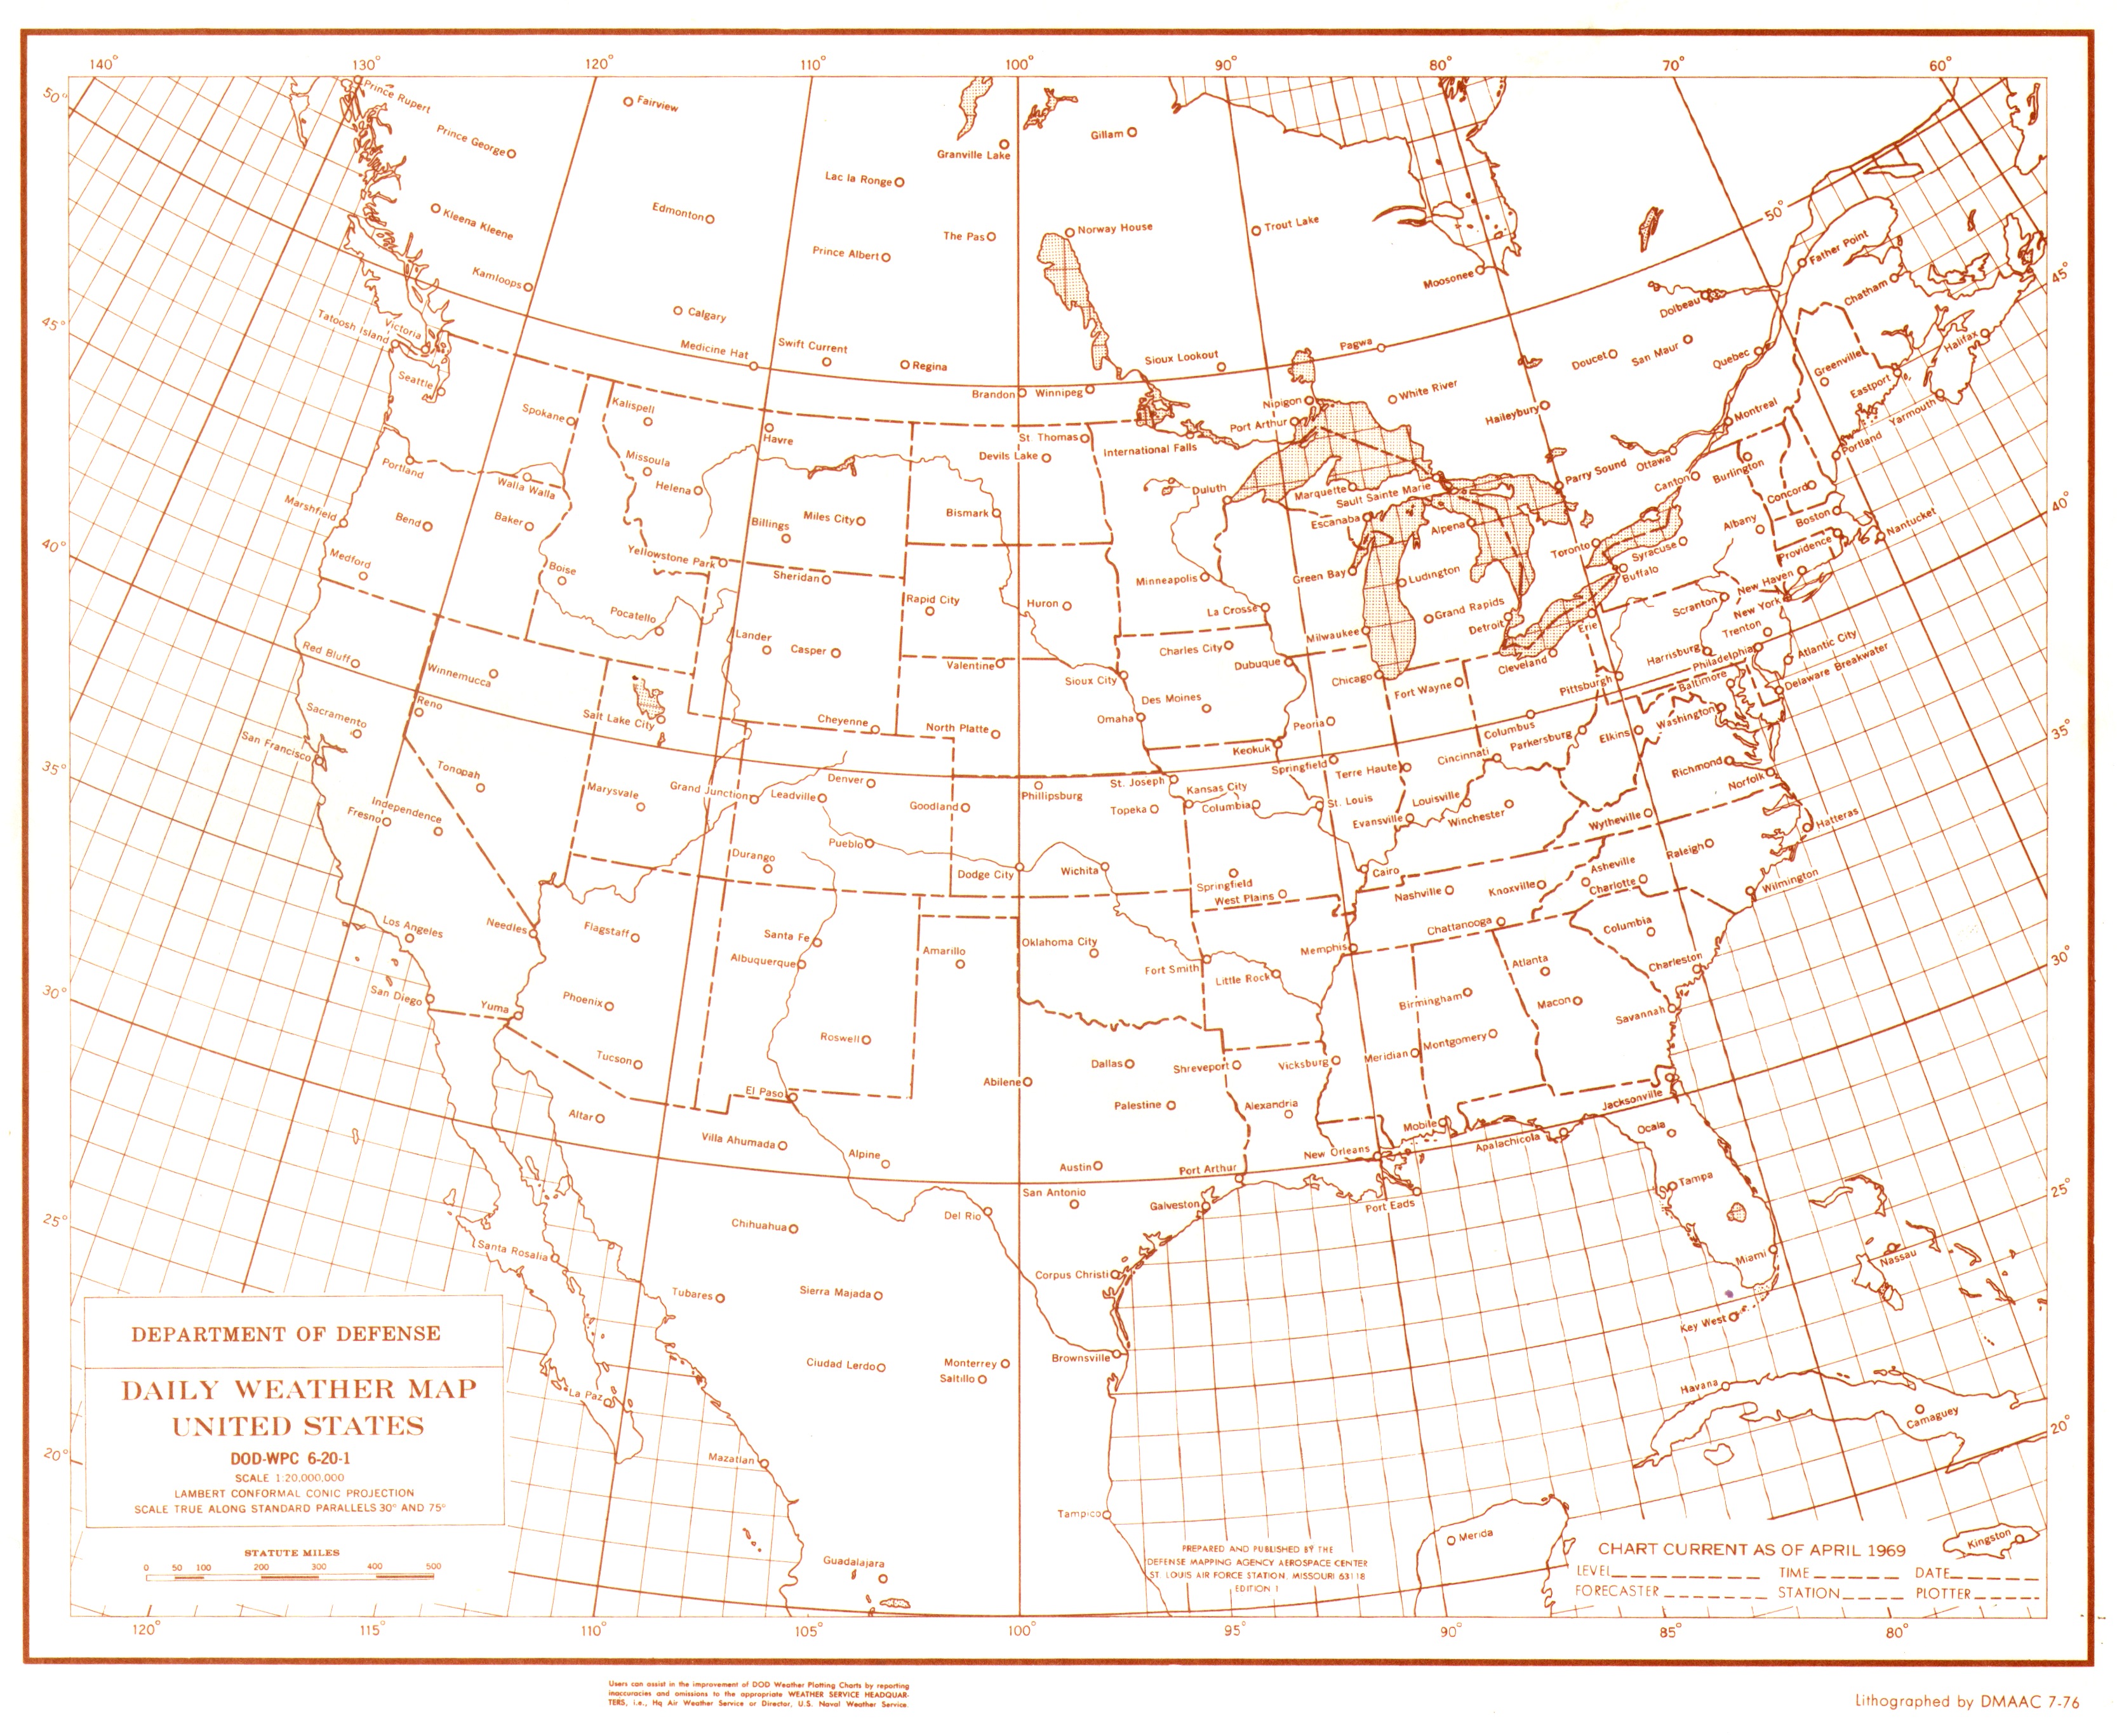
Daily Weather Map JPG: wpc-6-20-1_us_1969.jpg PDF: wpc-6-20-1_us_1969.pdf |
|
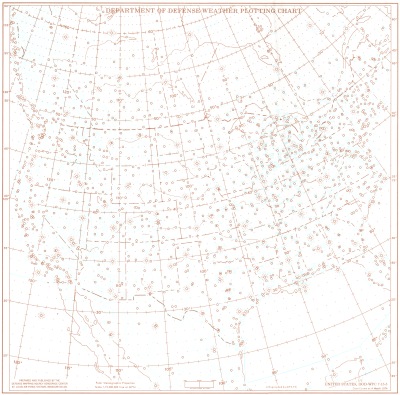
United States upper air & synoptic plotting chart (1974) JPG: wpc-7-15-5_1974.jpg PDF: wpc-7-15-5_1974.pdf |
|
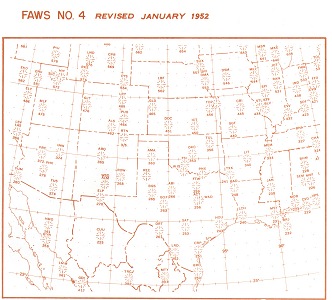
South Central United States (1952) JPG: wpc-faws4_1952.jpg PDF: wpc-faws4_1952.pdf |
Station Locator Charts |
|
|
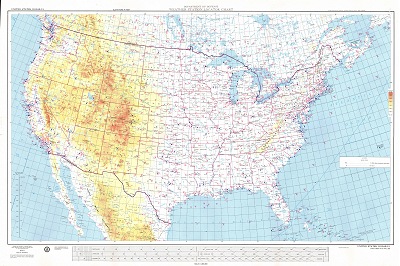
Weather Plotting Chart: United States JPG: slc-1.pdf PDF: slc-1.pdf |
|
Weather Plotting Chart: Southwest Asia JPG: slc-5.jpg PDF: slc-5.pdf |
Miscellaneous |
|
|
U.S. Tornadoes 1930-74 (Theodore Fujita) JPG: fujita_us_tor.jpg PDF: fujita_us_tor.pdf |
|
Norman radar worksheet, 1963 JPG: koun_radar_1963.jpg PDF: koun_radar_1963.pdf |