
Malaysia Airlines Flight 370
Meteorological and oceanographic images
|
* 2014-03-16 update: The Gulf of Thailand satellite images below have been updated; adds Mike McKay's position and provides IR coverage for the pre-dawn hours.
* 2014-03-16 update: See the new Southeast Indian Ocean zooms to look for contrails.
* 2014-03-14 update: Added satellite imagery for the speculative westward diversion, plus current (potential debris drift) and sea surface temperature (survivability aspects) for that area.
* 2014-03-13 update: Shifted upper air charts to west.
* 2014-03-13 update: Added new GMS-7 imagery sourced from EUMETSAT. After 5 days, given a 20 cm/s low-end current for the Gulf of Thailand, anything from the flight floating in the sea would have drifted about 90 km. Assuming the Gulf is where the plane ended up, this would suggest some evidence could start to wash up on shores over the next few days.
Also see:
* Southeast Indian Ocean early morning visible satellite imagery
* Analysis of a suspected contrail in South Indian Ocean (initially posted March 18)
This is a collection of relevant meteorological charts for the missing Malaysia Airlines Boeing 777 flight. Weather is not believed to be a factor and this is indeed the dry season for southeast Asia, so these are provided merely for those who wish to explore the information further. As is normal for weather charts, wind shafts always point into the wind. Normal long barbs are 10 kt, short barbs are 5 kt, and flags are 50 kt.
* Date/time of flight disappearance: 2014-03-07 17:22 UTC.
* Astronomical details: Night. Moon is not present after disappearance time (moonset at IGARI took place at 16:37 UTC; sunrise 23:16 UTC).

2014-03-07 1730-1900 UTC 10.8 micron infrared animation at the time of disappearance to 1.5 hours afterward. MKK is Mike McKay's position (8.38,108.70). Lat/long graticule is at 2-degree intervals.

2014-03-08 2200-0100 UTC 10.8 micron infrared animation during the pre-dawn hours. No imagery was available between 1900-2200. Lat/long graticule is at 2-degree intervals.
2014-03-08 2330-0130 UTC visible animation during the early morning hours. Lat/long graticule is at 2-degree intervals.
NORTHERN ARC (China/Pakistan/etc) destinations: 2014-03-08 2330-0200 UTC infrared animation providing an overview of potential northwest destinations. This is for 7-10 hours after takeoff. Bright white cloud indicates cold (typically high) cloud forms, and dark gray delineates warm (i.e. low) cloud types. Lat/long graticule is at 10-degree intervals.
SOUTHERN ARC (Southern Indian Ocean) destinations: See the special Indian Ocean zooms page for detailed imagery.
2014-03-08 0000 UTC winds and heights across Asia for 250 mb (roughly FL340). This includes radiosonde plots at actual observation sites. An interpolated wind field is overlaid.
2014-03-07 1200 UTC winds and heights across Asia for 250 mb (roughly FL340).
2014-03-08 0000 UTC winds and heights across Asia for 250 mb (roughly FL340).
2014-03-07 1200 UTC winds and heights across Asia for 500 mb (roughly FL180).
2014-03-08 0000 UTC winds and heights across Asia for 500 mb (roughly FL180).
2014-03-07 1200 UTC winds and heights across Asia for 700 mb (roughly 10,000 ft).
2014-03-08 0000 UTC winds and heights across Asia for 700 mb (roughly 10,000 ft).
2014-03-07 1200 UTC winds and heights across Asia for 850 mb (roughly 5,000 ft).
2014-03-08 0000 UTC winds and heights across Asia for 850 mb (roughly 5,000 ft).

2014-03-07 1800 UTC surface chart for the Malaysia-Vietnam area. Temperature and dewpoints in deg F.

2014-03-08 0000 UTC sounding for Kota Bahru, Malaysia (see the upper level map at the very top of page; this is station 48615). This is a fairly stable and benign sounding; it is advised not to read too much into the stability numbers.
2014-03-08 0000 UTC sounding for Ho Chi Minh City, Vietnam (see the upper level map at the very top of page; this is station 48900). This is a fairly stable and benign sounding; it is advised not to read too much into the stability numbers.

Indian Ocean modelled sea surface current on March 14, 2014, useful for determining track of any debris or lifeboats. There is very little day-to-day change. As a benchmark, 100 cm/s is equal to 1.9 kt, or 46 nm per day. If there was a downing short of the Andaman Islands, any debris would enter a convergent accelerating current along the southern Sri Lankan coast in the weeks ahead. For more graphics see: http://www7320.nrlssc.navy.mil/GLBhycom1-12/INDIAN.html.
Indian Ocean modelled sea surface temperature on March 14, 2014. There is very little day-to-day change. For more graphics see: http://www7320.nrlssc.navy.mil/GLBhycom1-12/INDIAN.html.
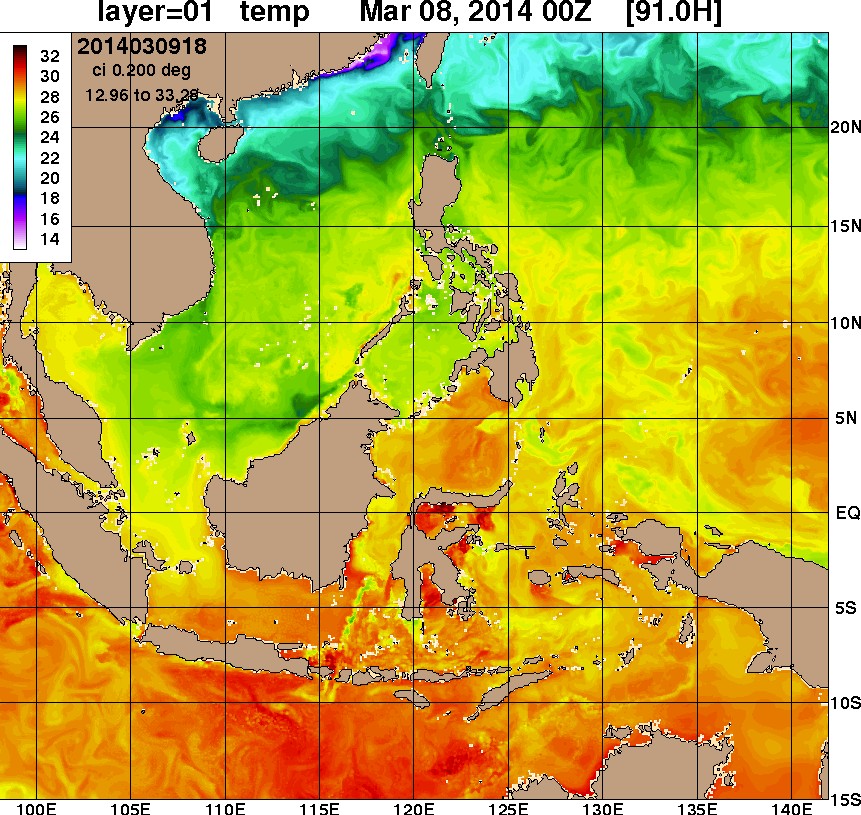
2014-03-08 0000 UTC sea surface temperature for the South China Sea area. This and all the oceanographic products shown are windows from the U.S. Navy HYCOM global ocean model.
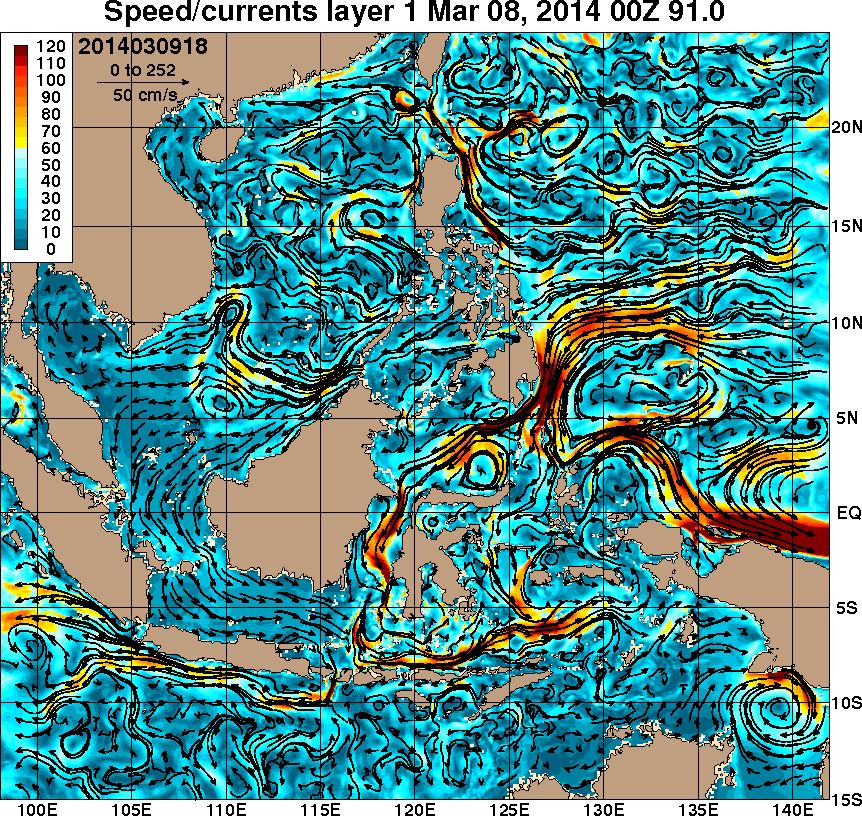
2014-03-08 0000 UTC modeled currents for the South China Sea area.
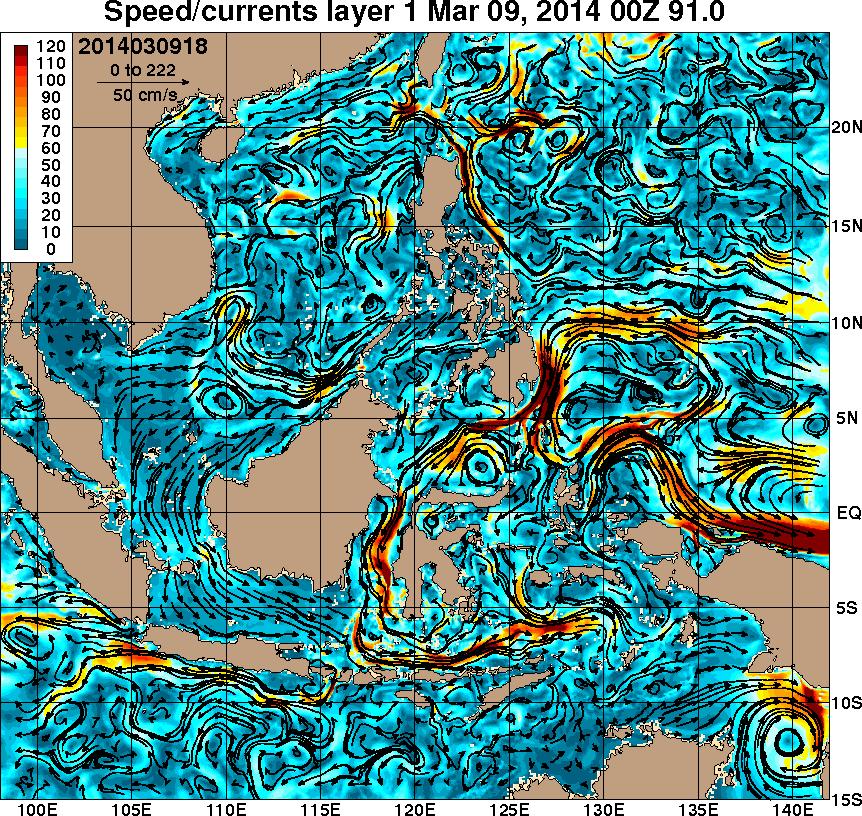
2014-03-09 0000 UTC modeled currents for the South China Sea area.
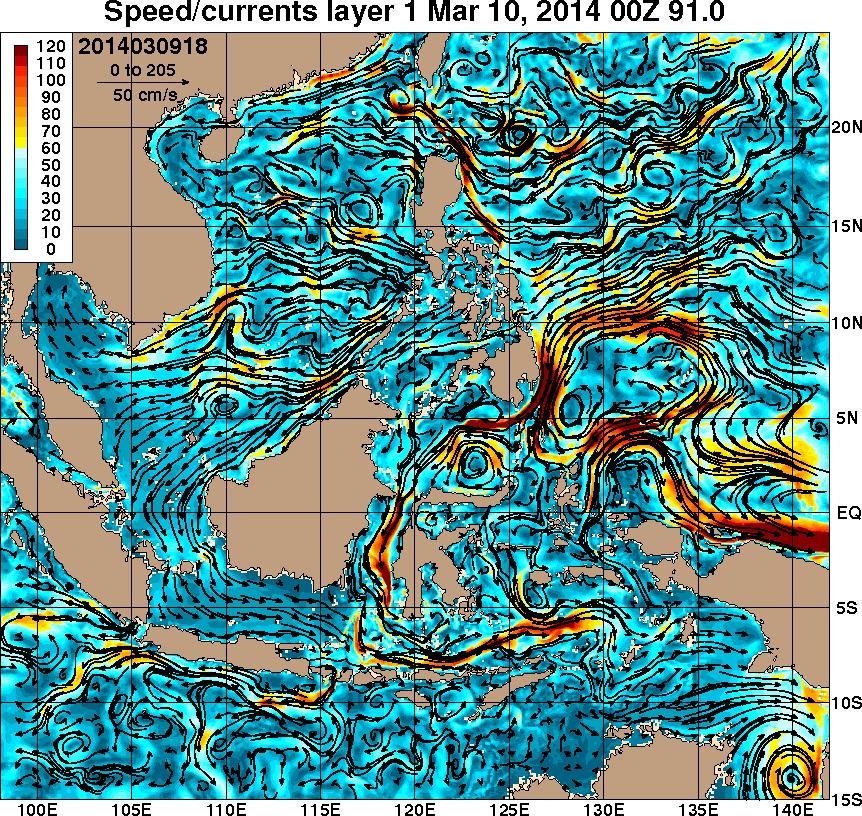
2014-03-10 0000 UTC modeled currents for the South China Sea area. This is a 6-hour forecast and is not observed or live data (and will not be updated on this page).
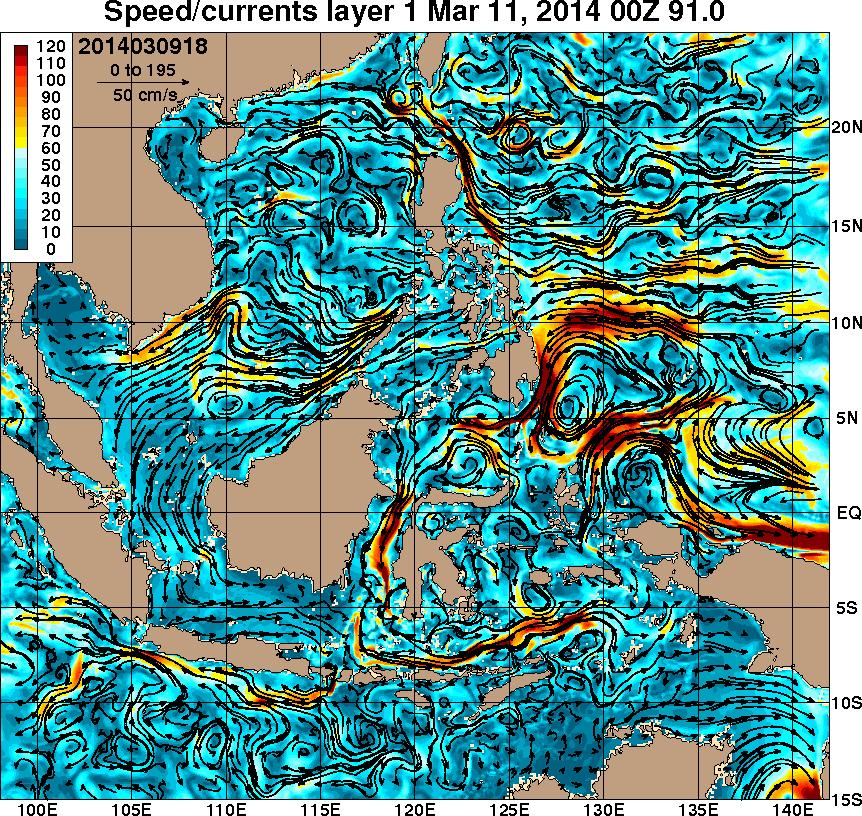
2014-03-11 0000 UTC modeled currents for the South China Sea area. This is a 30-hour forecast and is not observed or live data (and will not be updated on this page).
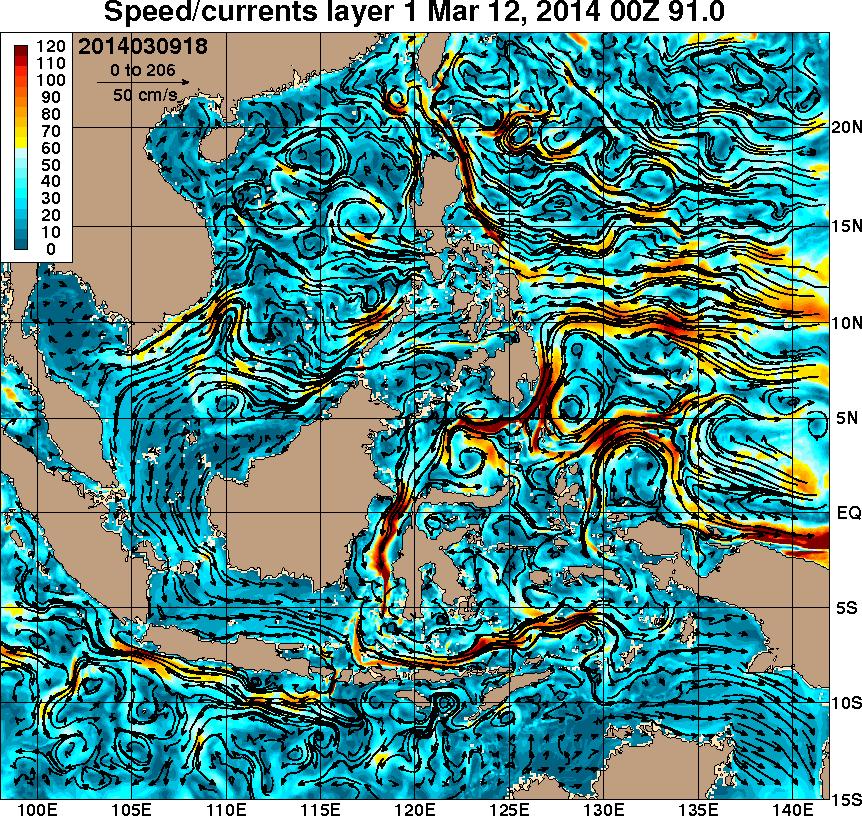
2014-03-12 0000 UTC modeled currents for the South China Sea area. This is a 54-hour forecast and is not observed or live data (and will not be updated on this page).
Tim Vasquez is a meteorologist and owner of Weather Graphics in Norman, Oklahoma. He served as an aviation weather forecaster in the U.S. Air Force for 10 years before moving into meteorological programming and consulting. He has written 7 forecasting textbooks to date and is a columnist for Weatherwise and IFR magazines.
© 2014 Weather Graphics