


The long-awaited Fourth Edition of WEATHER MAP HANDBOOK has arrived, providing a visual
approach to forecasting in the mid and late-2020s. Designed to endure constant use at analysis and
operations desks, this comprehensive guide details almost
every meteorological chart in use today. It is tailored for the digital age, showcasing the
preferred sources for professionals and offering a thorough list of weather map types,
appropriate usage, weather map symbols, iconographs, and decoding information.
The Fourth Edition phases out the older DIFAX charts and replaces them with up-to-date AWIPS
graphics from the 2020s. This is the same forecast system used by the National Weather Service
and often referred to in journals.
The Fourth Edition complements our other top-selling title,
Weather Analysis & Forecasting.
While the fundamental science of forecasting remains unchanged, the internet and innovative
technologies have entirely transformed the process. In today's age, both weather enthusiasts and National
Weather Service forecasters often access resources from the same websites. To help users navigate the
ever-growing array of online weather imagery and data, the WEATHER MAP HANDBOOK employs a double-page
format that covers a wide variety of weather maps, images, and products. Each entry includes background
information, purpose, limitations, and useful tips, along with a summary of analysis symbols and chart
markings. In-depth analysis is provided for surface, 850 mb, 700 mb, 500 mb, and 300-200 mb charts,
as well as thickness, isentropic, and Q vector products.
Most sections of WEATHER MAP HANDBOOK have been thoroughly revised and rewritten, and updated
with new information. New charts and
resources have also been added. All web links have been inspected and updated. Some sections
have been left intact, mostly those with historical perspective or of a more technical nature.
The book, as with the previous edition, dedicates a large chapter to the WSR-88D Doppler Radar, a crucial
tool for United States weather services. This in-depth section covers the radar's essential features
and algorithms, including considerable amounts of obscure and hard-to-find details. Readers will gain insight into everything
from the Composite Reflectivity product's inner workings to the Mesocyclone Detection Algorithm's workings.
All radar content has been extensively checked, rewritten, and revised.
The handbook delves into the specifics of various numerical forecast models, such as the
GFS, NAM, ECMWF, and HRRR, with expanded emphasis on ensemble forecasting. The satellite
chapter has been updated to cover the GOES-R series, explaining the creation and interpretation
of visible, infrared, and water vapor imagery and adding a multispectral section.
For weather observation, the METAR, TAF, SYNOP, and TEMP radiosonde formats are provided, complete with
decoding instructions.
The book concludes with an appendix featuring surface and upper-level station plot models,
an extensive technical glossary compiled from the NWS, SPC, and NCEP, and much more. The
WEATHER MAP HANDBOOK is an invaluable resource for hobbyists, private forecasters, professionals,
and students alike.
Who it's for
With technical content that's light on theory and complex information, Weather Map Handbook makes a great selection for avid professionals, weather enthusiasts, storm chasers, emergency managers, broadcasters, boaters, and anyone who wants to learn practical, everyday forecasting in an refreshing format.
About the author
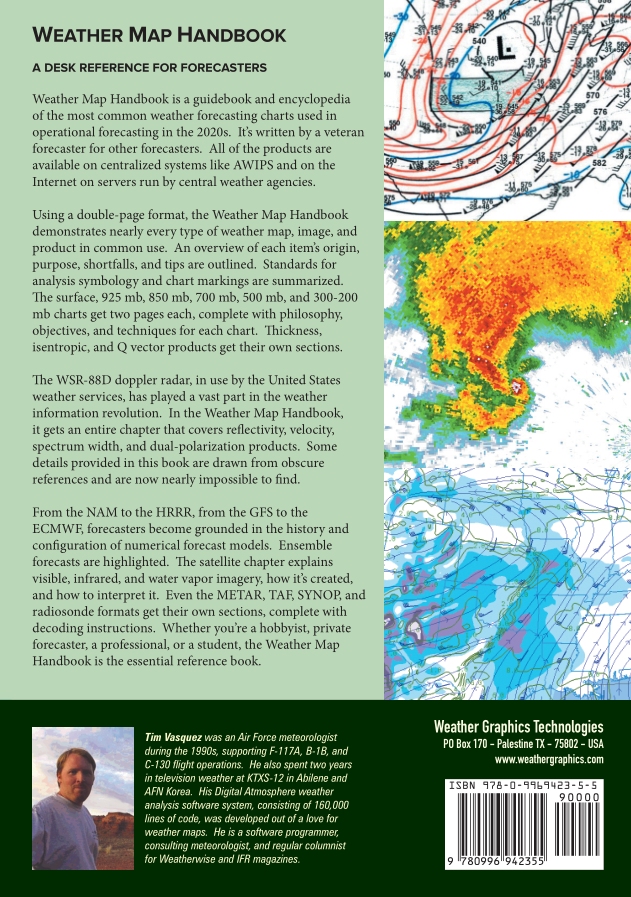
Tim Vasquez began a meteorology career in 1984 writing the weather page for a Dallas newspaper. From 1989 to 1998 he was an Air Force meteorologist and worked at two television stations. He developed the Digital Atmosphere weather analysis software system in use worldwide. Residing in Texas, he is a software programmer, a consulting meteorologist, and a columnist for Weatherwise magazine.
|
Contents
The forecast process Analysis charts SURFACE 925 MB 850 MB 700 MB 500 MB 300/250/200 MB TERRAIN FOLLOWING CHARTS THICKNESS ISENTROPIC ANALYSIS VORTICITY DIAGNOSTICS VERTICAL VELOCITY Q VECTOR DIAGNOSTICS PRECIPITABLE WATER POTENTIAL VORTICITY CROSS SECTION DIAGRAM THERMODYNAMIC DIAGRAM WIND PROFILERS LIGHTNING DETECTION Satellite imagery VISIBLE IMAGERY INFRARED IMAGERY WATER VAPOR IMAGERY GOES ABI BANDS MULTISPECTRAL IMAGERY Radar REFLECTIVITY COMPOSITE REFLECTIVITY VELOCITY SPECTRUM WIDTH DIFFERENTIAL REFLECTIVITY CORRELATION COEFFICIENT SPECIFIC DIFFERENTIAL PHASE HYDROMETEOR CLASSIFICATION PRECIPITATION TOTAL VERTICALLY INTEGRATED LIQUID ECHO TOPS STORM TRACKING INFORMATION HAIL ALGORITHM MESOCYCLONE DETECTION TORNADO DETECTION VAD WIND PROFILE FREE TEXT MESSAGE |
Human forecasts STORM PREDICTION CENTER WEATHER PREDICTION CENTER AREA FORECAST DISCUSSIONS Numerical weather prediction GFS MODEL NAM MODEL RAP & HRRR MODELS ECMWF MODEL OTHER IMPORTANT MODELS ENSEMBLE PREDICTIONS MODEL SOUNDINGS HISTORICAL MODELS Raw data SYNOP SURFACE OBSERVATIONS METAR SURFACE OBSERVATIONS TERMINAL AERODROME FORECAST RADIOSONDE OBSERVATIONS Appendix 1A - SURFACE PLOT SCHEMATIC 1B - UPPER AIR PLOT SCHEMATIC 2A - ICAO REGIONS 2B - WMO REGIONS 3 - DESCRIPTORS 4 - PRESENT WEATHER 5 - CLOUD GROUPS 6 - ISOPLETHS 7 - CHART ANALYSIS SYMBOLOGY 8 - STABILITY INDICES 9 - MILLER'S SEVERE PARAMETERS 10 - SATELLITE GALLERY 11 - POLARIMETRIC PRECIPITATION DETECTION 12 - WSR-88D PRODUCT LIST Glossary References and Further Reading Index |